It’s 2:47 a.m. You’re staring at the ceiling, unable to sleep, and a thought drifts in: “How many people on Earth are awake right now, just like me?” It’s tempting to dismiss it as “a few hundred million insomniacs” and roll over — but the planet is bigger than your ceiling implies. At the exact moment you’re tossing in bed, there are billions of people across the Pacific eating lunch.

.jpg)
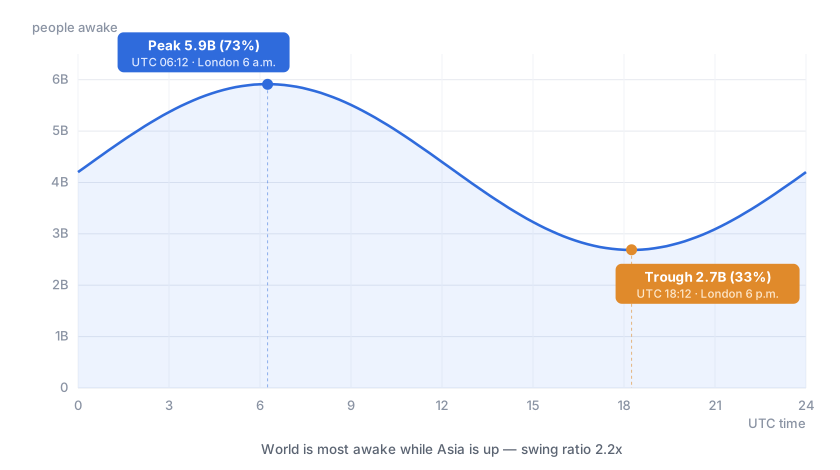
What makes this question genuinely interesting is how badly our intuitions fail us. Most people guess “roughly half the Earth is in daylight, so maybe 4 billion?” That sounds reasonable, but it’s wrong in both directions. Even at the quietest moment of the day, roughly 2.7 billion people have their eyes open. And the peak isn’t 4 billion — it’s about 5.9 billion. The swing ratio is 2.2×. More striking still: the world is most awake when London is fast asleep.
INPUT
World Population and Time Zone Distribution
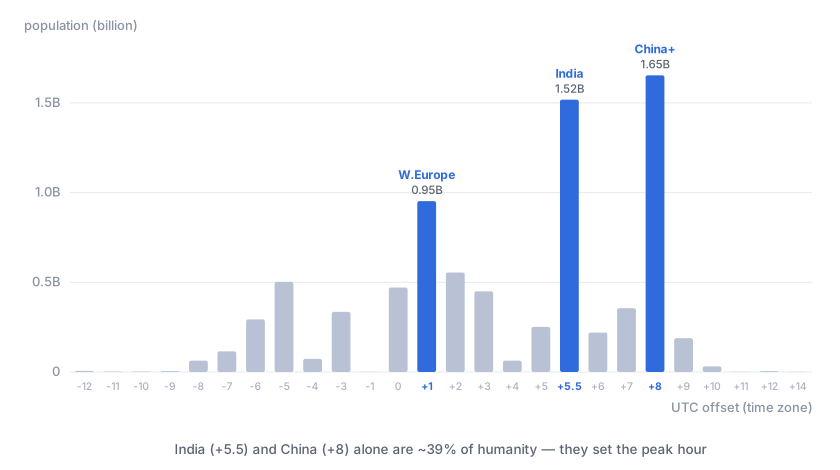
We set global population at 8.11 billion.[1] That population is allocated across 26 UTC offset buckets.[2]
India operates on UTC +5:30 — a half-hour offset that fits no standard slot — and gets its own bucket.[3] Each bucket’s population is drawn from UN DESA 2024 country-level estimates assigned to their representative UTC offset, with ±5% rounding error.
| UTC Offset | Representative Countries / Regions | Population (billions) |
|---|---|---|
| +14 | Kiribati (Line Islands) | 0.001 |
| +12 | New Zealand, Fiji | 0.005 |
| +11 | Solomon Islands, Vanuatu | 0.001 |
| +10 | Eastern Australia, Papua New Guinea | 0.031 |
| +9 | South Korea, Japan | 0.188 |
| +8 | China, Taiwan, Malaysia, Philippines, Singapore, western Indonesia | 1.653 |
| +7 | Thailand, Vietnam, Cambodia, Laos, central Indonesia | 0.356 |
| +5.5 | India, Sri Lanka | 1.517 |
| +6 | Bangladesh, Myanmar | 0.220 |
| +5 | Pakistan, Uzbekistan, Tajikistan | 0.251 |
| +4 | UAE, Oman, Azerbaijan, Armenia | 0.063 |
| +3 | Western Russia, Saudi Arabia, Kenya, Ethiopia, Iraq | 0.450 |
| +2 | South Africa, Egypt, Ukraine, Poland, Romania | 0.555 |
| +1 | Western Europe (France, Germany, Italy, Spain), Nigeria, Algeria | 0.952 |
| 0 | UK, Iceland, West Africa (Ghana, Côte d’Ivoire, etc.) | 0.471 |
| −1 | Cape Verde, Azores | 0.001 |
| −3 | Brazil, Argentina, Chile, Uruguay | 0.335 |
| −4 | Venezuela, Bolivia, Paraguay, Atlantic Canada | 0.073 |
| −5 | US Eastern (New York, Florida), Peru, Colombia, Ecuador | 0.502 |
| −6 | US Central, Mexico, Guatemala, El Salvador | 0.293 |
| −7 | US Mountain, western Canada | 0.115 |
| −8 | US West Coast (California), British Columbia | 0.063 |
| −9 to −12 | Alaska, Hawaii, Pacific Islands | 0.015 |
| Total | 8.11 billion |
The raw bucket sum (7.75 billion) falls short of the UN DESA total (8.11 billion) by 360 million — that gap is redistributed proportionally (×1.0465) across all buckets to keep the numbers consistent.[11] The key observation: China (+8) holds 1.65 billion people and India (+5.5) holds 1.52 billion. Two buckets account for 39% of all humanity. This single fact determines where the global wakefulness curve peaks. When UTC +5.5 and +8 are in daylight — roughly UTC 00:00 to 10:00 — there is no way for the remaining 61% to prevent a peak during those hours.
For comparison: Europe (UTC 0 to +2) totals 1.978 billion; the Americas (UTC −3 to −8) total 1.359 billion. Asia’s two dominant buckets (3.170 billion combined) nearly match Europe and the Americas together (3.337 billion). The Earth is heavy on its eastern side.
Activity Rate Function — Sinusoidal Model
We define as the fraction of a time zone’s population that is awake at local time . The model uses a sinusoidal (sine wave) function:
Parameter rationale:
- — Even at 4–5 a.m., night-shift workers (roughly 8% of the workforce) plus habitual night owls put a floor of about 12% awake.[4]
- — The US American Time Use Survey (ATUS) finds 93–95% of respondents active around midday.[5] We take the midpoint, 0.94.
- h (4:30 a.m. local time) — The hour of maximum sleep depth, per ATUS and Sleep Cycle 2024 data.[6]
Derived parameters:
Model limitations: A sine wave smooths out a real asymmetry in waking behavior — people wake up sharply (an S-curve between 6–8 a.m.) and wind down gradually (10 p.m.–midnight). ATUS data shows this clearly. A pure sinusoid treats both slopes as identical. The ATUS parameters also carry a US bias: average bedtimes in India and Bangladesh run about 30–60 minutes earlier than in the US, which would shift the peak UTC time roughly 30 minutes earlier if corrected.[7]
Day-of-Week and Season Corrections
- Weekends: Wake times shift about 60 minutes later on Saturdays and Sundays.[8] In the formula this appears as h added to the nadir, which pushes the global peak from UTC 06:12 to UTC 07:12. The magnitude (5.91 billion) barely changes.
- Seasons: Roenneberg (2012) found wake times advance ~30 minutes in summer and retreat ~30 minutes in winter.[9] Two mechanisms contribute: daylight-saving time (DST) shifts UTC offsets in Western Europe and North America by ±1 hour; and solar-driven circadian phase shifts. With 88% of the world’s population in the Northern Hemisphere, north–south cancellation is incomplete.[10] Net effect on peak magnitude: under 1% — treated as a secondary correction.
FORMULA
Core Formula
Global wakefulness at UTC time :
Where:
- = UTC offset (e.g., South Korea +9, India +5.5, New York −5)
- = population of the bucket at offset
- = phase correction (weekday 0, weekend +1 h, summer −0.5 h, winter +0.5 h)
- = current local time in that bucket
The key mechanism: fix , vary , and each bucket gets a different local time. Plug that local time into , multiply by population , sum across all buckets. The clamp prevents the sine wave from going below 12% — there are always night-shift workers and insomniacs.
Peak Calculation: UTC 06:00
Plugging h, weekday (), into the four largest buckets:
India (+5.5): local time (11:30 a.m.)
Awake population:
China and Southeast Asia (+8): local time (2:00 p.m.)
Awake population:
Western Europe (+1): local time (7:00 a.m. — morning commute hour)
Awake population:
Russia, Middle East, East Africa (+3): local time (9:00 a.m.)
Awake population:
Sum of these four buckets alone: billion. Adding the remaining 22 buckets — Thailand/Vietnam (+7, 356 million), Bangladesh/Myanmar (+6, 220 million), Pakistan (+5, 251 million), UK and West Africa (0, 471 million), and so on — yields the full sum:
Trough Calculation: UTC 18:00
At h, the most populous region — Asia — has crossed into the middle of the night.
India (+5.5): local time (11:30 p.m.)
Awake population: (just above the of 0.12)
China and Southeast Asia (+8): local time (2:00 a.m.)
Awake population:
Western Europe (+1): local time (7:00 p.m. — evening wind-down)
Awake population:
Here is where an important reversal appears. The activity rate at 7 p.m. local time (0.280) is not the same as at 7 a.m. (0.780). This counterintuitive result follows directly from the sinusoidal model: 7 a.m. sits 2.5 hours after the nadir, while 7 p.m. sits 14.5 hours after it (equivalently, 9.5 hours before the next nadir). Their sine values are equal in magnitude but opposite in sign: versus . In plain English: 7 p.m. is an evening, not a second morning. The planet is already winding down.
Summing all remaining buckets:
Hourly Table — All 26 Buckets
Calculated for every UTC hour from 00:00 to 23:00:[12]
| UTC | Seoul | London | New York | People Awake |
|---|---|---|---|---|
| 00:00 | 09:00 | 00:00 | 19:00 | ~4.20 billion (52%) |
| 01:00 | 10:00 | 01:00 | 20:00 | ~4.62 billion (57%) |
| 02:00 | 11:00 | 02:00 | 21:00 | ~5.02 billion (62%) |
| 03:00 | 12:00 | 03:00 | 22:00 | ~5.37 billion (66%) |
| 04:00 | 13:00 | 04:00 | 23:00 | ~5.65 billion (70%) |
| 05:00 | 14:00 | 05:00 | 00:00 | ~5.83 billion (72%) |
| 06:00 | 15:00 | 06:00 | 01:00 | ~5.91 billion (73%) ← peak |
| 07:00 | 16:00 | 07:00 | 02:00 | ~5.88 billion (73%) |
| 08:00 | 17:00 | 08:00 | 03:00 | ~5.74 billion (71%) |
| 09:00 | 18:00 | 09:00 | 04:00 | ~5.51 billion (68%) |
| 10:00 | 19:00 | 10:00 | 05:00 | ~5.19 billion (64%) |
| 11:00 | 20:00 | 11:00 | 06:00 | ~4.81 billion (59%) |
| 12:00 | 21:00 | 12:00 | 07:00 | ~4.40 billion (54%) |
| 13:00 | 22:00 | 13:00 | 08:00 | ~3.98 billion (49%) |
| 14:00 | 23:00 | 14:00 | 09:00 | ~3.58 billion (44%) |
| 15:00 | 00:00 | 15:00 | 10:00 | ~3.23 billion (40%) |
| 16:00 | 01:00 | 16:00 | 11:00 | ~2.95 billion (36%) |
| 17:00 | 02:00 | 17:00 | 12:00 | ~2.77 billion (34%) |
| 18:00 | 03:00 | 18:00 | 13:00 | ~2.69 billion (33%) ← trough |
| 19:00 | 04:00 | 19:00 | 14:00 | ~2.72 billion (34%) |
| 20:00 | 05:00 | 20:00 | 15:00 | ~2.86 billion (35%) |
| 21:00 | 06:00 | 21:00 | 16:00 | ~3.09 billion (38%) |
| 22:00 | 07:00 | 22:00 | 17:00 | ~3.41 billion (42%) |
| 23:00 | 08:00 | 23:00 | 18:00 | ~3.79 billion (47%) |
Precise Peak and Trough (0.1-Hour Resolution)
Sweeping the full 24-hour cycle in 6-minute increments:
Scenario Comparison
| Scenario | Peak (billions) | Peak UTC | Trough (billions) | Swing ratio |
|---|---|---|---|---|
| Weekday, central assumptions () | 5.91 | 06:12 | 2.69 | 2.20× |
| Weekend (+1 h wake delay) | 5.91 | 07:12 | 2.69 | 2.20× |
| Summer (−30 min wake) | 5.91 | 05:42 | 2.69 | 2.20× |
| Winter (+30 min wake) | 5.91 | 06:42 | 2.69 | 2.20× |
| (more night activity) | 6.12 | 06:12 | 3.29 | 1.86× |
| (less night activity) | 5.79 | 06:12 | 2.32 | 2.49× |
Robust conclusion: Across weekdays, weekends, and seasons, the peak lands in the UTC 05:42–07:12 window and the swing ratio stays near 2.20×. The dominant source of uncertainty is . If nighttime activity rates range from 6% to 22%, the swing ratio spans 1.86× to 2.49×.
Why Is the Swing Ratio “Only” 2.2×? — Spherical Geometry
Earth is a sphere. The Sun always illuminates exactly half its surface. But the “sunlit hemisphere” and the “densely populated hemisphere” do not perfectly overlap.
At UTC 18:00, most of Asia has crossed into deep night — but US Eastern time (500 million people) is at 1:00 p.m., and US Central plus Mexico (293 million) is at noon, both at peak wakefulness. This “western hemisphere daytime” offsets a substantial chunk of “eastern hemisphere nighttime.” If 8 billion people were spread perfectly uniformly across all longitudes, the swing ratio would approach 1.0. Asia’s population concentration is what pushes it up to 2.2×.
In numbers: the theoretical minimum (all 8 billion people sharing one longitude and falling asleep simultaneously) would give . The actual trough (2.69 billion) is 2.8× that theoretical floor. The roundness of the planet lifts the minimum headcount by a factor of nearly three.
Extra Dimension: What Is Earth’s “Loneliest” UTC Hour?
UTC 18:12 is the global minimum, but that does not necessarily make it the loneliest hour. Let’s check the UTC 15:00–20:00 window for the moment when the most continents are simultaneously asleep:
UTC 15:00:
- Asia (+5.5 to +9): local 20:30–00:00 — India is in its evening; China and Korea are approaching midnight
- Europe (+1 to +2): local 16:00–17:00 — still afternoon
- US Eastern (−5): local 10:00 — mid-morning
UTC 18:00:
- Asia (+5.5 to +9): local 23:30–03:00 — almost entirely asleep
- Europe (0 to +2): local 18:00–20:00 — post-dinner wind-down (–)
- US Eastern (−5): local 13:00 — peak afternoon
UTC 18:12 is the unique crossroads where Asia is in deep night, Europe is unwinding after dinner, and the Americas are in full afternoon mode. The minimum global headcount is 2.69 billion, but most of those 2.69 billion are in the United States, Canada, and Latin America. In other words: at Earth’s loneliest moment, it is 1 p.m. in New York.
That observation carries a structural point. The wakefulness curve is never a simple “dayside population = awake population.” It is the product of three things tangled together: where people live (heavily weighted eastward), the activity function that varies by local time, and the asymmetry of human sleep patterns. Without summing 26 buckets, you cannot see this curve from intuition alone.
For a clean thought experiment: if all 8 billion people lived in the UTC +8 (Beijing) time zone, noon local time (UTC 04:00) would have 91% of 8.11 billion — 7.38 billion — awake, and the 4:30 a.m. nadir (UTC 20:30) would drop to 970 million (12%). Swing ratio: 7.6×. The fact that the real-world ratio is “only” 2.2× is the direct consequence of population being spread, however unevenly, across the full 360 degrees of longitude. The planet’s diversity is what cushions the swing.
OUTPUT
Two reversals.
Reversal one: The moment when the most people on Earth are awake is when London’s alarm clocks haven’t gone off yet. UTC 06:12 — 6 a.m. in London, 1 a.m. in New York, 11:30 a.m. in Mumbai, 2 p.m. in Beijing. While the average Londoner is still somewhere between dreaming and snooze-button, more than 1.5 billion South Asians and another 1.3 billion East Asians are well into their working day. The world doesn’t revolve around the Greenwich meridian — it just measures time from it.
Reversal two: Even at the quietest moment — the trough — 2.7 billion people are awake. That’s 33% of humanity. This is where the 2.2× swing ratio reveals its meaning. No matter how deeply one hemisphere sleeps, the opposite hemisphere is in daylight and its billions are going about their afternoon. Lying awake at 3 a.m. feeling like the only conscious person on the planet? The numbers say otherwise. You have roughly 2.7 billion neighbors on shift.
The sturdiest finding in this calculation: no matter how you tune , no matter whether it is a Tuesday or a Saturday, the peak stays pinned around UTC 06:00. As long as 1.52 billion people live in India (+5.5) and 1.65 billion in China (+8), the world’s wakefulness peak will occur while London is waking up and New York is in the small hours. They would have to relocate to a different longitude for that to change.
References
[1]: UN DESA, “World Population Prospects 2024 — Key Findings”, https://population.un.org/wpp/ (2024). Mid-2024 estimate: 8.11 billion.
[2]: UN DESA, “World Population Prospects 2024 — Country Data”, https://population.un.org/wpp/Download/Standard/Population/ (2024). Country-level populations assigned to representative UTC offsets.
[3]: Wikipedia, “Time in India”, https://en.wikipedia.org/wiki/Time_in_India — India uses UTC+5:30 as a single national time zone and does not observe DST.
[4]: U.S. Bureau of Labor Statistics, “American Time Use Survey (ATUS) 2023”, https://www.bls.gov/tus/ — Activity rate at 4–5 a.m. approximately 8–12%, including night-shift workers.
[5]: U.S. Bureau of Labor Statistics, “American Time Use Survey (ATUS) 2023”, https://www.bls.gov/tus/ — Around 93–95% of respondents active near noon.
[6]: Sleep Cycle AB, “Sleep Report 2024”, https://www.sleepcycle.com/sleep-science/sleep-report-2024/ — Global median sleep midpoint roughly 3–5 a.m. US figure (ATUS-based) approximately 4:30 a.m. adopted.
[7]: Roenneberg, T. et al. (2012), “Social Jetlag and Obesity”, Current Biology 22(10), 939–943, https://doi.org/10.1016/j.cub.2012.03.038 — Discusses US bias in ATUS parameters and divergence from sleep patterns in developing nations.
[8]: Roenneberg, T. et al. (2012), ibid. Weekend wake times average ~60 minutes later than weekdays (social jetlag).
[9]: Roenneberg, T. et al. (2012), ibid. Seasonal wake-time phase shifts: approximately −30 min in summer, +30 min in winter.
[10]: UN DESA, “World Population Prospects 2024”. Countries at latitude ≥ 0° (Northern Hemisphere) account for approximately 88% of global population.
[11]: Raw bucket total 7.75 billion vs. UN DESA global figure 8.11 billion; gap of 360 million redistributed proportionally (×81.1/77.5 = ×1.0465). Wikipedia, “List of UTC time offsets”, https://en.wikipedia.org/wiki/List_of_UTC_time_offsets — reference for the 26-bucket UTC offset structure.
[12]: Calculations apply the sinusoidal model across 26 buckets in 0.1-hour steps. Peak: UTC 6.2 h, 5.914 billion. Trough: UTC 18.2 h, 2.686 billion. Swing ratio: 2.20.