A friend is reading through Genesis and stops mid-chapter. “There’s no way all those animals fit on one boat, right?” It’s a fair pause before answering. He wasn’t wrong to wonder — he’d simply never actually run the numbers on how many species “all those animals” means, or how many cubic meters “one boat” comes out to.
This piece doesn’t answer the question theologically. It takes the ark’s dimensions and voyage length exactly as Genesis states them, treats the rest as a pure volume-and-biology problem, and runs the numbers. Spoiler: space turned out to be surprisingly generous. Air was the actual bottleneck.
INPUT
The ark’s physical dimensions
Genesis 6:15 specifies the ark’s dimensions as “three hundred cubits long, fifty cubits wide, and thirty cubits high.”[1] Since the text hands us a fixed figure, we use it as-is.
The question is how many meters a cubit actually is. A cubit was an ancient unit of length based on the distance from elbow to fingertip, so it varied by culture and era. Egyptological research puts the common cubit at roughly 0.45 m (about 1.48 ft), and the royal cubit used as a national standard at roughly 0.52 m (about 1.71 ft).[2] There’s no way to know for certain which one the author of Genesis had in mind, so this piece carries both values through: 0.45 m as the conservative case, 0.52 m as the generous one.
The space actually usable for animals and cargo isn’t the full hull volume. You have to subtract structural framing, walkways, feed storage, and drainage/ventilation space. Modern livestock-barn and cargo-ship loading practice suggests a usable-space ratio of roughly half the gross volume.[3] This isn’t a measured figure — it’s an engineering-style inference — so this piece flags it explicitly as an assumption: .
How many species need to board
This is where the definitional trouble starts. “Every kind of animal, male and female” — how widely you draw the boundary of “every kind” changes the required headcount enormously.
(a) Extant terrestrial vertebrates. Today’s known terrestrial vertebrates number roughly 6,500 mammal species, 11,000 bird species, 11,700 reptile species, and 8,500 amphibian species — about 37,700 species total.[4] This piece adopts that figure as the central scenario.
© The “kind” framework. Genesis 6:20 says animals came “according to their kinds” — not “species” in the modern taxonomic sense, but a broader category. Young-earth creationist scholarship has reframed this as baraminology (from baramin, a coined term for “created kind”), treating it as a much broader classification than species. Woodmorappe (1996) estimates roughly 8,000 such kinds; Answers in Genesis materials put the range at roughly 1,400–7,000.[5][6] These figures aren’t part of any mainstream taxonomic consensus — they’re estimates produced within a specific theological framework. This piece treats them only as a reference range under the condition “if you accept this framework.”
(b) What if insects are included? Described insect species alone number roughly 1 million, and including other arthropods pushes the total to about 1.13 million.[7][8] This piece excludes that category from the calculation, for two reasons. First, most theological readings limit the ark’s cargo to “land animals that require human care.”[1] Second, many insects are thought to survive outside the ark in egg or larval form. As we’ll see below, forcing all insects aboard barely moves the volume needle anyway — the exclusion is an interpretive choice, not a space-driven one.
The volume of one animal
Converting 37,700 species into volume requires knowing each species’ body mass. Vertebrate body-size distribution skews overwhelmingly toward the small end.[9] This piece approximates it with four size classes.
| Size class | Species count | Representative mass |
|---|---|---|
| Small (rodents, small birds, amphibians, etc.) | 32,000 | 0.05 kg |
| Medium (mid-size mammals, raptors, etc.) | 4,500 | 2 kg |
| Large (deer, large predators, etc.) | 1,000 | 50 kg |
| Extra-large (elephant, giraffe class) | 200 | 2,000 kg |
Animal density is approximated at roughly 1,000 kg/m³, close to water.[10] That’s the standard approximation for biological tissue, which is mostly muscle, fat, and water.
Oxygen and metabolism
An animal breathing in a sealed space consumes oxygen. Consumption doesn’t scale linearly with body mass — it scales with mass to the 0.75 power, a long-standing rule in physiology known as Kleiber’s law.[11] In practice, larger animals burn less oxygen per unit of body weight. An elephant outweighs a mouse by orders of magnitude, but its oxygen use per kilogram is far lower. That exponent (0.75) is still the most widely used standard value in physiology, though whether the “true” exponent is 0.75 or 2/3 (0.667) remains debated.[12] This piece adopts 0.75, the more conventional figure.
To convert that calorie burn into oxygen volume, we use the standard conversion of about 4.8 kcal per liter of O₂ — a figure derived from the respiratory quotient (the ratio of heat produced to oxygen consumed as food is oxidized), taken at its average value.[13]
Air in a sealed space is about 21% oxygen by volume.[14] Total oxygen aboard the ark is the usable volume multiplied by that ratio.
Finally, we also run a reversal scenario: hibernation. Hibernating mammals drop body temperature and metabolic rate sharply — research shows metabolic rate can fall to somewhere between 1/20 (light torpor) and 1/100 (deep hibernation) of baseline.[15] Obviously, the premise that every species hibernates simultaneously is itself biologically shaky — amphibians and many tropical/subtropical ectotherms don’t hibernate this way at all, and Kleiber’s law itself doesn’t transfer cleanly to ectotherms.[11] This piece treats the scenario strictly as a counterfactual — “what if.”
Voyage length follows the dates recorded in Genesis 7–8. Rain fell for 40 days (Genesis 7:12), and the full duration from entry to disembarkation works out to roughly 370 days.[16]

FORMULA
Step 1 — The ark’s volume
Plugging in the cubit values:
Usable volume applies the 50% factor:
The diagram below shows the proportions of 300×50×30 cubits (135 m × 22.5 m × 13.5 m at the 0.45 m conversion — about 443 ft × 74 ft × 44 ft).
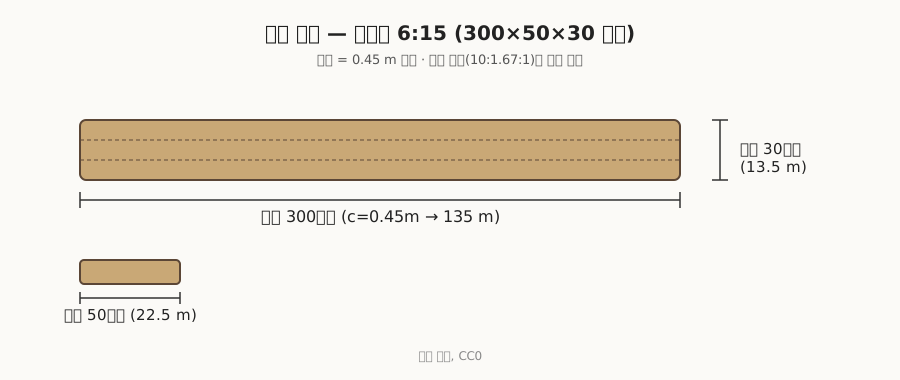
For scale, 135 m is longer than an American football field including both end zones (about 110 m) — roughly the length of a mid-size cruise ship today, or about a third of the Titanic (269 m). This comparison isn’t accidental: the Ark Encounter, a full-scale wooden ark replica built to these same 300×50×30-cubit proportions in Williamstown, Kentucky (opened 2016; operated by Answers in Genesis, the organization cited above for the “kind” framework), markets itself explicitly on being “longer than the Titanic was tall.” If you’ve ever stood in a museum next to a to-scale hull diagram of an ocean liner, you already have decent gut intuition for what 41,000 m³ of enclosed hull looks like — this calculation just puts a number on the feeling.
Step 2 — Required animal volume and load ratio
For each size class, we compute volume for two animals per species (a breeding pair). Volume is mass divided by density (1,000 kg/m³).
| Size class | Species | Volume per species (2 animals) | Subtotal |
|---|---|---|---|
| Small (0.05 kg) | 32,000 | ||
| Medium (2 kg) | 4,500 | ||
| Large (50 kg) | 1,000 | ||
| Extra-large (2,000 kg) | 200 |
Summing:
Load ratio is that figure divided by usable volume.
Using the 0.52 m cubit gives more usable volume, so the load ratio drops further.
What about the “kind” framework? Scaling the size-class distribution proportionally to species count (against the 37,700-species baseline):
No matter which species-count definition you pick, the direction of the conclusion doesn’t change. The load ratio stays under 5% across the board.
What if we force in all 1.13 million insect species? A single insect’s representative volume is around 1 mL (0.000001 m³) — vanishingly small. Even summing 1.13 million species × 2 individuals adds only about 2–3 m³ total. The effect on load ratio is under 0.01 percentage points. That confirms the earlier point: excluding insects was never a volume decision — it’s purely interpretive.
Step 3 — Oxygen consumption
Using Kleiber’s law, we compute basal metabolic rate per individual by size class, then convert to oxygen consumption.
| Size class | Representative mass | BMR (kcal/day) | O₂ per individual (L/day) | Individuals (species×2) | Subtotal (L/day) |
|---|---|---|---|---|---|
| Small | 0.05 kg | 64,000 | 98,688 | ||
| Medium | 2 kg | 9,000 | 220,735 | ||
| Large | 50 kg | 2,000 | 548,421 | ||
| Extra-large | 2,000 kg | 400 | 1,744,574 |
Total:
Notably, the 200 extra-large species — elephants, giraffes, and the like — account for roughly two-thirds of total oxygen consumption. Small in headcount, large in appetite.
Step 4 — Time to oxygen depletion
Total oxygen aboard is 21% of usable volume (0.45 m cubit case).
Depletion time is stock divided by consumption rate.
This 1.65-day figure, though, is a floor value derived from an extreme assumption: total sealing, meaning zero air exchange between the ark’s interior and the outside for the entire voyage. There’s no real basis for believing that condition actually held for all 370 days. Genesis 6:16 explicitly specifies a window (tsohar) built into the ark,[1] and after the rains stopped (Genesis 8), there appears to have been a substantial period with the ark open. So this number shouldn’t be read as “the ark would have died within days” — it’s better read as a sensitivity indicator: “here’s how fast things turn dangerous if you seal it completely.” The real question isn’t whether the ark was fully sealed, but how much ventilation it actually needed.
Step 5 — The hibernation reversal scenario
What if every animal aboard were hibernating simultaneously? We compute two cases: light torpor (metabolism at 1/20) and deep hibernation (1/100).
A single hibernation assumption stretches depletion time from two days to nearly half a year — a swing of up to 100x. It’s the single most consequential variable in this entire calculation.
Step 6 — Comparing against voyage length
Genesis records a total stay of roughly 370 days.[16] Compared against the normal-metabolism depletion time:
Even applying deep hibernation — the most generous assumption available — the shortfall persists.
Even with the most extreme assumption on the table, air supply doesn’t cover half the voyage. The hibernation scenario moves the result by 100x, but it never flips the underlying conclusion.
Step 7 — So how much ventilation was actually needed?
If total sealing isn’t the answer, the question needs to change. Instead of “how many days does it last,” the real question is: “how often does the air need to be exchanged to keep oxygen concentration from dropping to a dangerous level?”
Indoor air-quality standards classify anything below roughly 19.5% oxygen as an oxygen-deficient atmosphere, with symptoms like headaches and impaired judgment starting to appear around 16%.[17] This piece treats the drop from 21% to 16% — a 5-percentage-point swing — as the danger threshold.
Completely replacing the ark’s air once (one full air change) recovers an oxygen quantity equal to usable volume times that 5-percentage-point margin.
Dividing daily oxygen consumption (2,612.4 m³/day) by that figure gives the number of daily air exchanges needed to keep oxygen concentration above 16%.
In other words: if the entire volume of air inside the ark gets swapped out for outside air roughly 2.5 times a day — once every 9 to 10 hours or so — the oxygen budget balances. That’s nowhere near an unreasonable ventilation rate. Given enough windows or openings, natural convection driven by wind or temperature differentials alone routinely achieves several air changes per hour (ACH) in the ventilation-engineering systems used in building design.[18] The ark would only have needed 2–3 exchanges per day, not per hour — a comparatively low bar to clear.
That said, this calculation only tracks oxygen depletion. In practice, carbon dioxide buildup from all that exhaled breath could become a problem before oxygen scarcity does.[17] But the fix for CO₂ buildup is the same fix: air exchange. In the end, the variable that decided whether the ark’s occupants could survive wasn’t “total sealing vs. ventilation” as an abstract binary — it was simply whether enough air exchange was happening.
OUTPUT
At the central scenario — 0.45 m cubit, 37,700 vertebrate species — here’s how it adds up. The load ratio comes out to about 4.5%, meaning the ark was surprisingly roomy as far as cargo holds go — space alone was never a tight squeeze.
Oxygen tells a more complicated story. Sealed completely, with zero air exchange the entire voyage, the air runs out in about 1.65 days. But that’s an extreme floor value, not a realistic forecast — there’s no reason to think the ark was hermetically sealed like a vacuum bag for all 370 days. What it actually needed wasn’t an escape from total sealing, but reasonable ventilation. Run the numbers, and keeping oxygen concentration above the danger threshold (about 16%) requires roughly 2.5 air exchanges a day — the entire volume of air swapped out once every 9 to 10 hours. By natural-ventilation standards, that’s not a demanding ask at all.[18]
So the real variable that decided the ark’s fate wasn’t “can they breathe or not” — it was “sealed or ventilated.” It’s probably not a coincidence that Genesis 6:16 bothers to mention a window, or that chapter 8 describes a long stretch of open-air time after the rain stopped. Only in the worst-case scenario — total sealing — does the ark actually run out of breathing room.
The variable that swung this calculation hardest was still the hibernation assumption. Dropping the metabolic rate by a factor of 100 stretched the fully-sealed depletion time by exactly the same factor (1.65 days → roughly 165 days). And yet the core conclusion of this piece — that ventilation is what mattered — holds whether or not hibernation is factored in at all. Anyone who’s done Fermi estimation (quick order-of-magnitude calculation) runs into this pattern often: the variable that moves the needle the most isn’t always the one that flips the conclusion.
Volume and air are accounted for. What’s left is the water itself — all that freshwater and seawater sloshing together. Exactly how salty it would have ended up is the subject of the next piece.
References
[1]: Genesis 6:15-16, 6:19-20, 7:12, chapters 7-8 (cited per the Korean 개역개정 translation; wording here follows standard English translations such as the KJV/ESV for equivalent verses)
[2]: Arnold, D. (1991). Building in Egypt: Pharaonic Stone Masonry. Oxford University Press. — Source for the Egyptian common cubit (0.45 m) and royal cubit (0.52 m).
[3]: Modern livestock-facility and marine cargo loading design practice, accounting for structural framing, walkways, and storage space (an engineering-style inference, not a single measured source; adopted here as an explicit assumption)
[4]: IUCN Red List (2024), Summary Statistics, https://www.iucnredlist.org/resources/summary-statistics — Described species counts for extant mammals, birds, reptiles, and amphibians.
[5]: Woodmorappe, J. (1996). Noah’s Ark: A Feasibility Study. Institute for Creation Research. (Young-earth creationist literature, not mainstream taxonomic consensus; “kind” count cited conditionally.)
[6]: Answers in Genesis, “How Many Animals Were on the Ark?”, https://answersingenesis.org/noahs-ark/how-many-animals-were-on-noahs-ark/ (Young-earth creationist literature; “kind” concept cited conditionally.)
[7]: Catalogue of Life (2024), Annual Checklist, https://www.catalogueoflife.org — Described insect species count.
[8]: Zhang, Z.-Q. (2013). “Animal biodiversity: An outline of higher-level classification and survey of taxonomic richness.” Zootaxa, 3703(1), 5-11.
[9]: Smith, F.A. et al. (2004). “Body Mass of Late Quaternary Mammals.” Ecology, 85(10), 2003 (data supplement) — Reference for mammalian body-mass distribution.
[10]: Standard approximation of biological tissue density relative to water, general physiology reference.
[11]: Kleiber, M. (1932). “Body size and metabolism.” Hilgardia, 6(11), 315-353. — Basal metabolic rate scaling law (BMR ∝ mass^0.75).
[12]: White, C.R. & Seymour, R.S. (2003). “Mammalian basal metabolic rate is proportional to body mass^2/3.” PNAS, 100(7), 4046-4049. — Modern re-examination and debate over the Kleiber exponent.
[13]: Standard oxygen-to-calorie conversion based on respiratory quotient (RQ), roughly 4.8 kcal per liter O₂ — a standard exercise physiology value.
[14]: NOAA/NASA/USAF, U.S. Standard Atmosphere, 1976 — Atmospheric oxygen fraction (~21%).
[15]: Geiser, F. (2004). “Metabolic rate and body temperature reduction during hibernation and daily torpor.” Annual Review of Physiology, 66, 239-274. — Metabolic suppression rates during hibernation.
[16]: Genesis 7:11-8:14, dates back-calculated (total stay from entry to disembarkation ≈ 370 days), cited per the Korean 개역개정 translation.
[17]: NIOSH (National Institute for Occupational Safety and Health), Respiratory Protection Program, Oxygen Deficient Atmospheres — Defines atmospheres below 19.5% oxygen (vs. the normal 21%) as oxygen-deficient, with physiological symptoms such as headache and impaired judgment appearing from around 16%.
[18]: ASHRAE Standard 62.1, Ventilation for Acceptable Indoor Air Quality — Standard reference for typical air-changes-per-hour (ACH) rates achievable by natural ventilation systems.