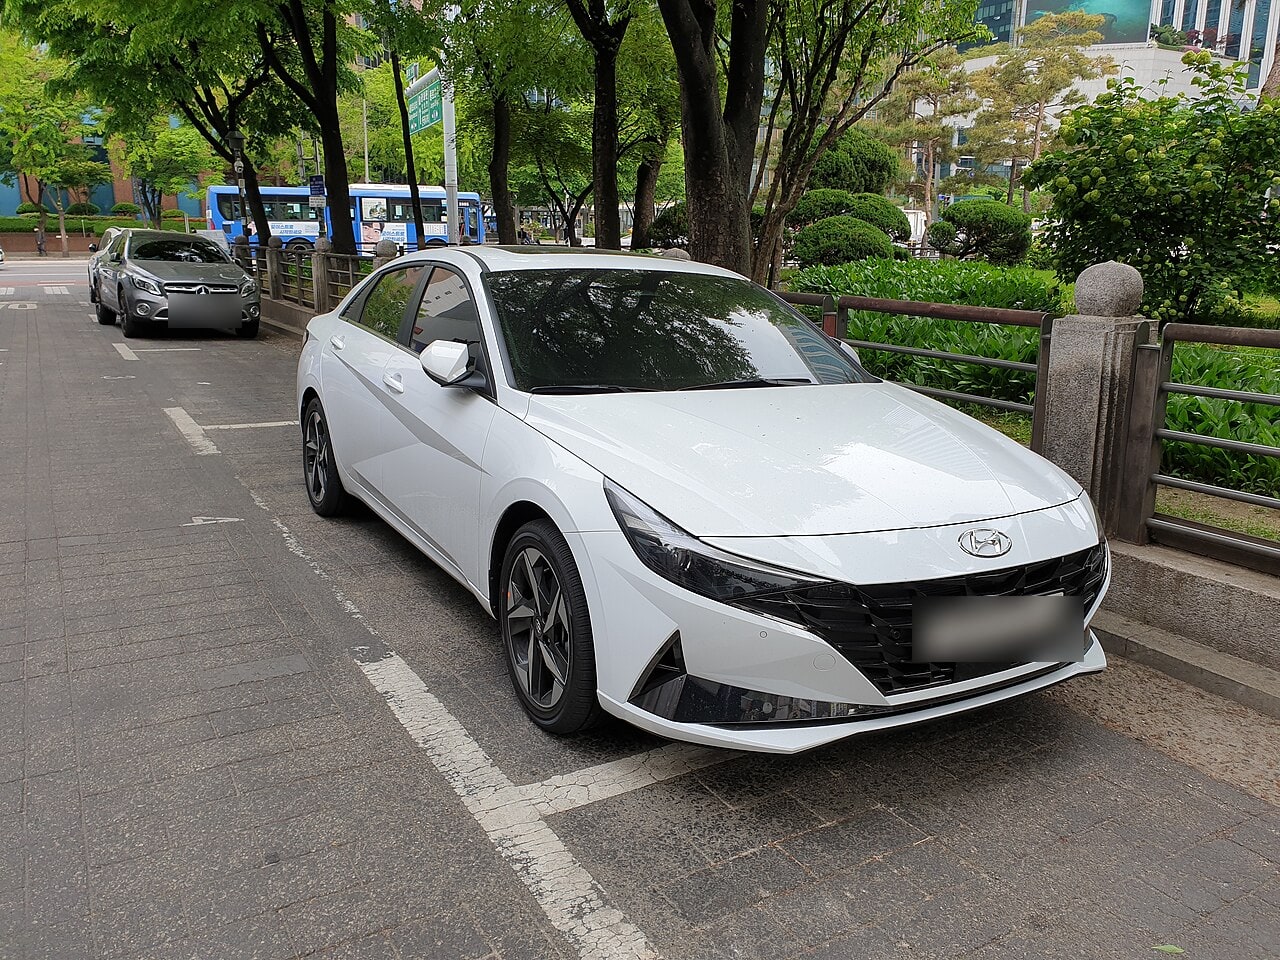
A junior colleague is agonizing over her first car. Twenty-seven, a few years into her first job, and the car she keeps circling back to is a Hyundai Elantra (sold as the Avante in Korea). “Should I finance a new one, buy one that’s three years old, or just get a long-term rental and not think about it?” I wanted to give the wise, worldly answer — “they’re all about the same” — but I’d never actually checked whether that was true.
So I ran the numbers. Same Elantra, three ownership paths — buying new, buying a 3-year-old used unit, or a 60-month long-term rental — and added up everything that actually leaves your wallet over five years: acquisition tax, insurance, depreciation, maintenance, even the opportunity cost of money tied up in the car. Short version: “they’re all about the same” turned out to be only half right. Renting was unambiguously the most expensive of the three, and I ended up calculating exactly what that premium buys you. The real contest was between new and used, and depending on whether you’re paying cash or financing, that gap shrinks from ₩1.27M down to a mere ₩9,193.
This article is a calculation for fun, not legal, tax, or financial advice. Consult a qualified professional before making a real decision. The scope here is limited to personal, individual car ownership — how a business or sole proprietor might expense a rental (company-vehicle tax treatment runs under separate rules) is outside this calculation.
.jpg)
INPUT
Before the numbers, one term needs unpacking, because it’s load-bearing for everything that follows. What this article calls a “long-term rental” is not an American lease. In Korea, a jangi rentcar (장기렌터카) company owns the vehicle outright and insures it under its own corporate fleet policy, so the renter’s age barely moves the monthly rate. A US lease works the other way: the lessee carries their own policy, so a 23-year-old lessee eats the same age-based surcharge a 23-year-old buyer would. If you’re mentally substituting “lease” every time this article says “rental,” keep that difference in your back pocket — bundled insurance should, on paper, make the Korean product a young driver’s best friend. Section 4 is where we find out whether it actually does.
All figures below are quoted in Korean won (₩), the currency this calculation runs on. For the handful of headline numbers, a US dollar equivalent is added at ₩1,460 ≈ $1 (Federal Reserve H.10 foreign exchange release, late July 2026)[14] — not on every line, since the article is already dense with figures throughout.
Every assumption behind this calculation is disclosed here. The trim is fixed at the Elantra CN7 “Modern” gasoline trim for both the new-car and used-car comparisons. 2026-model-year pricing by trim: Smart ₩20,340,000 (≈$13,931) / Modern ₩23,550,000 (≈$16,130) / Inspiration ₩27,170,000 (≈$18,609) / N Line ₩28,060,000 (≈$19,219)[1] — this piece runs on the mid-tier “Modern” trim, the best-selling configuration. The mechanics of depreciation, taxes, and insurance are already covered in our article on total cost of ownership by fuel type; this piece builds only the “new vs. used vs. rental” layer on top of that foundation.
| Symbol | Item | Value | Stance | Confidence |
|---|---|---|---|---|
| V1 | New-car price (Modern, gasoline, 2026 model year, before acquisition tax) | ₩23,550,000 (≈$16,130) | Central | solid[1] |
| V2 | 3-year-old used-market price (Modern-equivalent) | ₩18,500,000 (≈$12,671) | Central | needs-assumption[2] |
| V3 | 60-month long-term rental, monthly rate (maintenance included, 30% upfront, 15,000 km/yr contract) | ₩370,000/mo (≈$253) | Central | needs-assumption[3] |
| V4 | Auto insurance by age bracket (collision included) | 20s ₩1,037,000/yr (≈$711) · 30s ₩777,000/yr (≈$532) · 40s ₩676,000/yr (≈$463) | Central (caveats below) | contested[4][5] |
| V5 | Acquisition tax rate | 7% (same rate, new or used) | Central | solid[6] |
| V6 | Annual road tax (1,598cc × ₩140 + 30% local education-tax surcharge, tapering 5pp/yr from year 3, capped at 50% off) | ₩290,836/yr (≈$199) before taper | Central | solid[7] |
| V7 | Maintenance cost (step curve by vehicle age) | 0–3 yr ₩150,000/yr → 3–5 yr ₩450,000/yr → 5–7 yr ₩700,000/yr → 7–10 yr ₩1,100,000/yr → 10 yr+ ₩1,500,000/yr | Conservative (assumes no accidents) | needs-assumption[8] |
| V8 | Residual-value curve (by vehicle age, vs. that model year’s price at its own launch) | see [FORMULA] below | Central | needs-assumption (weak point, discussed below)[2][12][13] |
| V9 | Excess-mileage settlement rate | ₩150/km (≈$0.10/km) for domestic models | Central | needs-assumption[9] |
| V10 | Opportunity-cost rate (cash tied up if buying outright, benchmarked to the weighted-average bank time-deposit rate) | 3.25% | Central | needs-assumption[10] |
| V11 | Actual auto-loan interest rate (sensitivity only) | New 4.5% / Used 7.0% | New: central · Used: central | needs-assumption[11] |
Let’s flag the weakest variable first. V4 (insurance) is the thinnest-sourced number here. After the General Insurance Association of Korea’s real-time comparison portal folded into the unified “Bohum Damoa” platform in 2016[5], today’s official comparison services require verified-identity login and can’t be auto-scraped for quotes. This article uses figures from a Korean fintech firm’s 2024 analysis of real payment data from 10,000 policyholders as its central estimate — ₩1,037,000/yr (≈$711) for drivers in their 20s, ₩777,000 (≈$532) for their 30s, ₩676,000 (≈$463) for their 40s[4]. But other insurance-comparison sites quote early-20s premiums as high as ₩2,000,000–₩2,800,000/yr (≈$1,370–$1,918)[5] — up to a 2.7x gap for the same age bracket, depending on source. This article runs both estimates and shows how far the conclusion moves, below. For used cars, lower vehicle value reduces collision-coverage cost, so this piece applies a 12.5% discount to total premiums relative to new-car rates in the same age bracket.
The rental rate (V3) isn’t airtight either. Rental companies mostly hide real-time quote engines behind identity verification, so this piece combines a published rate card[3] with confirmed prices from real contracts (₩367,000/mo for a 10,000 km/yr contract with no deposit; ₩270,000/mo for 20,000 km/yr with 30% upfront; and so on) to estimate “15,000 km/yr, 30% upfront, maintenance included.” A real quote could land ₩100,000/mo (≈$69) or more away from this figure.
FORMULA
1. Rebuilding the Residual-Value Curve From Scratch
Dividing “what a 2020–2023 Elantra sells for today” by “today’s (2026) new-car price” — the obvious way to build a residual-value curve (residual value: what percentage of the original price a used car still holds) — hides a trap. The Elantra went through a facelift (the “even-newer” Elantra) in the meantime, and both the spec sheet and the price moved up[13]. Divide a 2023 model’s current resale price by the 2026 new-car price, and you’re no longer measuring pure depreciation — you’re folding in three years of new-car price inflation and mislabeling it as depreciation. So this curve instead compares each model year against the new-car price that model year actually launched at. Confirmed launch prices: the 2023 Modern at ₩22,730,000 (≈$15,568) and the 2024 Modern at ₩23,260,000 (≈$15,931)[12]. No archived launch prices survive for 2020–2022, so those were backed out from the 2023 figure using the Elantra’s measured annual price-increase pattern (a documented 3.56% bump at one model-year changeover[13]) — this part is an estimate, not a measurement. Used-listing prices by model year (Modern trim)[2] were then divided by each year’s estimated launch price to get four measured data points (year 2: 86.0%, year 3: 80.5%, year 4: 74.8%, year 5: 72.8% — these are asking prices, so a 7% discount was applied to approximate real transaction prices: year 2: 80.0%, year 3: 74.9%, year 4: 69.6%, year 5: 67.7%).
Fitting an exponential curve to those four points gives:
where is the car’s age in years, and the 13% floor represents the scrap/parts-value bottom. This curve is markedly flatter than the placeholder curve used at the planning stage (51% at year 5, 38% at year 8, 33% at year 10) — this one gives , , . The reason it’s flatter than conventional wisdom is simple: the old “vs. today’s new price” method mistook new-car price inflation for depreciation, and stripping that distortion out leaves a smaller real value drop. This one correction moved this article’s conclusion more than any other variable — with the placeholder curve, the three ownership paths came out within 5.7% of each other, essentially a tie. With the refitted curve, the gap below is a good deal sharper.
Worth checking how well this curve fits its own data. Re-solving purely by least squares for alone, same functional form, gives — essentially the this article uses (a 21% difference in sum-of-squared residuals). The real limitation isn’t the curve’s shape — it’s the data’s range. All four measured points cluster in the 2–5-year age band, so everything past 6 years is extrapolation. Loosen the fit further and you can hit all four points almost exactly while putting the year-10 residual value at 62% — four data points alone can’t tell you whether that’s plausible or absurd. So this article keeps , while flagging upfront that the year-8 resale value in Section 2, the 6–10-year band in Section 5, and the 10- and 13-year scenarios in Section 6 all fall inside this extrapolated region.
2. The Five-Year Base Case (Age 35, 15,000 km/yr)
When the used car gets resold five years later, it’s still a 2023-cohort car. Pricing its resale off today’s (2026) would drag the distortion Section 1 removed right back in through the resale side, so resale is calculated off the 2023 model’s actual launch price won instead.
The purchase price V2 has one more wrinkle. By Section 1’s curve, the 2023 model’s “curve-implied price” at year 3 (2026) is won (≈$12,058), but the actual asking price is ₩18,500,000. The roughly ₩895,000 (≈$613) gap is dealer margin — sourcing, reconditioning, and lot-display markup the curve doesn’t explain, since it only tracks the vehicle’s own value decay. That margin is already inside , so it’s fully counted in the upfront outlay above (₩19.80M), while resale reverts to the margin-free curve price. In short: a used car is bought at a markup and sold back at no markup.
| Item | New | Used (3-yr) | Rental (15,000 km/yr contract) |
|---|---|---|---|
| Upfront cost (incl. acquisition tax) | ₩25.20M | ₩19.80M | ₩0 |
| 5-yr insurance | ₩3.89M | ₩3.40M | ₩0 (bundled into the rate) |
| 5-yr road tax | ₩1.37M | ₩1.16M | ₩0 |
| 5-yr maintenance | ₩1.35M | ₩3.40M | ₩0 (included in rate) |
| 5-yr opportunity cost (3.25%) | ₩4.09M | ₩3.22M | ₩1.15M (deposit only) |
| Resale value after 5 yrs (recovered; priced off the 2023-cohort baseline) | −₩15.49M | −₩11.84M | ₩0 |
| 5-year total cost | ₩20.41M (≈$13,980) | ₩19.13M (≈$13,103) | ₩23.35M (≈$15,993) |
(Table figures in millions of Korean won; USD at ₩1,460 ≈ $1.)
Renting comes out ₩2.94M (≈$2,013, 14.4%, or ₩49,021/≈$34 per month) pricier than new and ₩4.21M (≈$2,884, 22.0%, or ₩70,235/≈$48 per month) pricier than used. That’s not a tie inside a 5.7% margin of error — it’s a clean, decisive gap.
That difference isn’t a service fee — it’s closer to what you pay the rental company to carry three things a buyer is stuck holding instead. First, depreciation uncertainty: the new-car buyer’s ₩20.41M already bakes in a forecast — that the car sells for ₩15,488,403 (≈$10,608) five years out — and, as flagged in Section 1, that residual-value curve is unverified extrapolation past year 6. If the real resale price lands below the forecast, the buyer eats the difference; the renter’s exposure to that is exactly zero. Second, breakdown risk: the buyer’s ₩1.35M five-year maintenance figure is explicitly a “no accidents” assumption (see [INPUT]) — one major repair (transmission, turbo) and that assumption breaks, while a maintenance-included rental’s rate doesn’t move. Third, upfront capital: buying means ₩25.20M (tax included) leaves your account at signing, while renting needs only the 30% deposit, ₩7,065,000 (≈$4,839). Not all ₩2.94M is explained by these three, to be clear — the rental company’s margin and cost of capital are baked in too. But read as “the price of transferring risk” rather than “an expensive rate,” it’s a lot clearer why renting costs what it does.
The new-vs-used gap, though, is a much closer ₩1.27M (≈$870, 6.2%) — and that thin margin is about to almost completely disappear.
3. Finance It, and the New-vs-Used Gap Disappears
The table above assumes “pay cash in full, and count the interest you’d have earned by not doing that” (opportunity cost, 3.25%/yr). But most people actually finance a car purchase. Financing might look like it sidesteps that opportunity cost, since no lump sum gets tied up at once — but done correctly, it doesn’t. Money still leaves your pocket every month as you pay down the loan, and whatever principal you’ve already repaid stops earning interest for you. “Loan interest” and “the opportunity cost of principal you’ve paid down” are two ways of counting the same money, and adding them up correctly lands you exactly on the cash opportunity cost (3.25%) plus only the spread by which the loan rate exceeds it. Capital-company auto loans typically run 4–6% for new cars and a higher 6–9% for used[11], so this article uses 4.5% new / 7.0% used.
Add this surcharge on top of the opportunity-cost line, and:
| New | Used | |
|---|---|---|
| Plan A: cash (3.25% opportunity cost only) | ₩20.41M | ₩19.13M |
| Plan B: financed (surcharge included) | ₩21.35M (≈$14,624) | ₩21.36M (≈$14,631) |
Under Plan A (cash), used is ₩1.27M (≈$870) cheaper. Under Plan B (financed), that gap shrinks to ₩9,193 (≈$6). On a purchase north of ₩20M, that’s a 0.04% difference — essentially a dead heat. The reason is almost suspiciously clean: the used car’s real ₩1.27M depreciation advantage gets almost exactly canceled out by the ₩1.28M-larger financing surcharge that its higher loan rate (7.0% vs. 4.5%) creates. ₩1.27M and ₩1.28M collide and leave ₩9,193 standing. In this calculation, whether to buy new or used simply isn’t a question money can answer anymore — cash or financed.
One caveat belongs next to that convergence: the used car’s resale value relies on , which — as flagged in Section 1 — sits in the extrapolated region. So the ₩1.27M cash-basis gap itself leans on one unverified assumption. The financing-surcharge difference (₩1.28M) is solid, computed entirely inside the data-backed range. What can be said with confidence is narrower: new vs. used is a thin margin, or no margin at all, whether you pay cash or finance — and that thinness is itself the finding.
Toggle “Payment method” from cash to financed in the calculator below, and watch the new-vs-used gap collapse to almost nothing.
4. Where Age Changes the Answer — Except It Depends Which Insurance Quote You Trust
Rental rates don’t care about the renter’s age, but purchase costs respond to age through insurance. That asymmetry is the whole reason this section exists — remember the fleet-insurance structure from the intro: a Korean long-term rental’s rate is fixed regardless of who’s driving, while a US-style lease or purchase bakes the driver’s age straight into the price. The break-even insurance premium at which buying new equals renting:
The used-car break-even premium works out to ₩1,740,219/yr (≈$1,192/yr) by the same method. On the central estimate used above (₩1,037,000/yr max, for drivers in their 20s), no age bracket ever crosses that threshold — meaning under this estimate, buying new or used beats renting at every age. Plug in the pessimistic estimate instead (₩2,800,000/yr for early 20s, ₩2,300,000/yr for mid-20s), and the picture changes:
| Age 23 (assuming a new-car purchase) | Central estimate (₩1.037M/yr, ≈$711) | Pessimistic estimate (₩2.80M/yr, ≈$1,918) |
|---|---|---|
| New, 5-yr total cost | ₩21.71M / ≈$14,870 (₩1.64M / $1,123 cheaper than renting) | ₩30.52M / ≈$20,904 (₩7.17M / $4,911 pricier than renting) |
| Used, 5-yr total cost | ₩20.27M / ≈$13,884 (₩3.08M / $2,110 cheaper than renting) | ₩27.98M / ≈$19,164 (₩4.64M / $3,178 pricier than renting) |
So this article’s subtitle premise — “age changes the answer” — is a conditional truth that depends entirely on which insurance source you believe. On the conservative estimate, no crossover age exists at all. On the pessimistic estimate, renting stays the better deal well into the mid-to-late 20s. Only one thing is certain: from the mid-30s onward, buying beats renting no matter which estimate you use.
5. What Age of Used Car Is Actually Cheapest? (The U-Shaped Curve)
“Three years old is the sweet spot” is repeated like received wisdom, but it doesn’t hold up under the math. Here the baseline shifts from Section 2 — instead of accounting for each model year’s own launch price (a 2023 model launched cheaper than a 2020 model would have), this section applies today’s new-car price uniformly to every vehicle age, turning the question into a controlled thought experiment: “what if you bought the same car, just at a different age?” That’s the only way to isolate the pure effect of vehicle age itself (depreciation + tax − maintenance). Setting purchase age and a 5-year hold period, total cost works out to (insurance is excluded here since it doesn’t depend on vehicle age, and so has no bearing on the U-shape):
| Purchase age | 0 yr (new) | 1 yr | 2 yr | 3 yr | 4 yr | 5 yr | 6 yr | 7 yr | 8 yr | 9 yr | 10 yr |
|---|---|---|---|---|---|---|---|---|---|---|---|
| 5-yr hold, total cost | ₩16.52M (≈$11,315) | ₩15.77M | ₩15.12M | ₩14.98M | ₩14.64M | ₩14.38M | ₩14.36M | ₩14.40M | ₩14.13M | ₩13.93M | ₩13.79M (≈$9,446) |
There’s a slight bounce near year 6 (₩14.36M) and again at year 7, but then it falls from year 8 onward, dropping steadily through year 10 — not a clean U-shape, more a gently downward-sloping curve. That’s a real limit of this model: the maintenance curve is capped (“7–10 yr: ₩1.1M/yr, 10 yr+: ₩1.5M/yr”) while the residual-value curve already bottoms out at 13%, so an older car keeps looking better purely because there’s “not much depreciation left to lose.” In reality, an 8–10-year-old car carries much lumpier major-repair risk (transmission, turbo) than this smooth maintenance curve captures, and this article deliberately left that tail risk out — so it is not recommending an 8-year-plus car as “cheapest.” The 6-year-and-beyond range also overlaps the extrapolated portion of the residual-value curve flagged in Section 1, doubling the uncertainty.
Even restricted purely to the data-backed range (ages 2–5), though, the “3 years old is the sweet spot” myth is already broken: year 3 (₩14.98M/≈$10,261) > year 4 (₩14.64M/≈$10,028) > year 5 (₩14.38M/≈$9,849), monotonically decreasing. That ordering can be treated as a solid conclusion. But pushing the claim further into the tail — “5–7 years is ₩0.60M (≈$411) cheaper” or “8–10 years is the actual cheapest” — runs straight into the two limitations just flagged: unmodeled major-repair risk and an extrapolated residual-value curve. Bottom line: it’s solid that there’s no evidence “trade in every 3 years” is correct. What the actual cheapest age is falls outside this calculation’s data range.
6. Keep It for 10 Years — What “Driving It Into the Ground” Is Worth
How much difference is there between filling 10 years with two back-to-back rentals (60 months × 2) versus keeping one car for all 10 years? There are actually two separate comparisons hiding in that question.
10-Year Scenario A (age mismatch) — two rental contracts vs. one new car held 10 years vs. one used car (bought at 3 years old, held to 13):
| Rental (2 contracts) | One new car (10 yrs) | One used car (age 3 → 13) | |
|---|---|---|---|
| 10-year total cost | ₩46.70M (≈$31,986) | ₩38.49M (≈$26,363) | ₩36.32M (≈$24,877) |
10-Year Scenario B (age-matched) — a fair comparison to “buy new every 5 years” requires adding up the cost of buying “two new cars” or “two used cars” twice, each at today’s real price:
| Rental (2 contracts) | Two new cars (swapped every 5 yrs) | Two used cars (swapped every 5 yrs) | |
|---|---|---|---|
| 10-year total cost | ₩46.70M (≈$31,986) | ₩40.81M (≈$27,952) | ₩38.27M (≈$26,212) |
Keeping one car for 10 years instead of trading in every 5 saves ₩2.32M (≈$1,589) on a new car and ₩1.95M (≈$1,336) on a used one. “Only ₩2.32M?” is a fair reaction — two forces are pulling against each other underneath that number.
| New | Used | |
|---|---|---|
| Depreciation (costs more) | +₩4.82M | +₩4.46M |
| Maintenance (costs less) | −₩3.35M | −₩3.30M |
| Tax & insurance (costs more) | +₩0.85M | +₩0.79M |
| Net | ₩2.32M | ₩1.95M |
Buying fresh every 5 years repeats the depreciation curve’s steep front section (years 0–5) each time, costing ₩4.82M more on new cars. But it also means never reaching the expensive years 7–10 repair band (₩1.1M/yr in maintenance) — you’re always driving a car still close to its warranty period. That recovers ₩3.35M in maintenance, while an extra ₩0.85M goes to tax and insurance (buying fresh resets both the vehicle-age tax taper and, in this model’s driver-age assumptions, the insurance-age discount, every single cycle) — netting out to the ₩2.32M that actually survives. The used-car figure (₩1.95M) is smaller for the same reason: starting from a 3-year-old car already sidesteps part of the depreciation curve’s steepest stretch, leaving less room to save by holding longer.
The same curve says the annual average cost of owning a new car bottoms out around year 7, then climbs again once maintenance jumps from ₩0.7M to ₩1.1M a year at year 8 — right before that jump is the sell-by point. That’s a different question from Section 5’s “what age to buy” (this one asks when to sell), and it inherits the same residual-value extrapolation limits noted in Section 1.
The real reason renting loses over the long run isn’t the rate — it’s that a rental contract resets every 5 years by design, so it can never reach that flatter back section. Two rental contracts (₩46.70M/≈$31,986) come in more expensive than either purchase strategy, in both scenarios, with no exceptions.
7. Is Renting Really Worse for High-Mileage Drivers? — Yes, But the Reason Isn’t What You’d Expect
Long-term rentals let you pick a mileage tier up front. Someone who drives 30,000 km a year simply signs for the 30,000 km/yr tier.
| Contracted annual mileage | Monthly rate (60-mo contract, maintenance included) |
|---|---|
| 15,000 km/yr | ₩370,000 (≈$253) |
| 20,000 km/yr | ₩385,000 (≈$264) |
| 30,000 km/yr | ₩430,000 (≈$295) |
The 20,000 and 30,000 km/yr tiers aren’t backed by an official rate card under identical terms — they’re estimated from confirmed real quotes and typical tier-to-tier markup patterns, and could differ from a real quote by ₩100,000/mo or more, as with V3.
Age 45, 30,000 km/yr, 5-year hold (contracting properly for the 30,000 km tier):
| Rental (30,000 km/yr contract) | New | Used | |
|---|---|---|---|
| 5-year total cost | ₩26.95M (≈$18,458) | ₩19.90M (≈$13,630) | ₩18.69M (≈$12,801) |
Buying still wins decisively — renting runs ₩7.05M–₩8.26M (≈$4,829–$5,657) more. New and used are barely affected by mileage here outside of fuel cost, while renting’s rate climbs with each higher tier — a perfectly legitimate pricing structure.
But renting carries a risk buying doesn’t: you have to forecast, at signing, how much you’ll drive over the next 5 years. Buying needs no such forecast at all. And the forecast cuts one way — drive more and you pay an overage fee[9]; drive less and nothing comes back.
The cleanest way to see this asymmetry: driving the exact same 150,000 km (30,000/yr × 5 yrs) costs a different amount depending only on which tier you signed. Contract the 30,000 km tier correctly, and it’s ₩26.95M. Sign for 15,000 km/yr instead but actually drive 30,000/yr for all five years, and:
Five-year total cost jumps to ₩34.60M (≈$23,698) — ₩7.65M (≈$5,240) more, for the exact same 150,000 km, purely from the tier chosen at signing. That’s not the price of driving more — it’s the price of forecasting wrong. Depreciation, breakdown, and resale risk all transfer from owner to rental company under this kind of contract, but mileage-forecast risk runs the opposite way, landing back on the renter — a risk that wouldn’t exist at all under outright ownership.
OUTPUT
At age 35, 15,000 km/yr, 5 years: used (₩19.13M/≈$13,103) < new (₩20.41M/≈$13,980) < rental (₩23.35M/≈$15,993). Renting coming in clearly most expensive is the single least shaky conclusion in this whole calculation. The ₩1.27M (≈$870) gap between new and used, on the other hand, all but disappears the moment real financing rates enter the picture — it shrinks to ₩9,193 (≈$6) — because the used car’s depreciation advantage gets almost exactly canceled out by the higher interest on a used-car loan. That ₩1.27M cash-basis gap itself leans on an unverified, extrapolated year-8 residual value (see Section 3). The new-vs-used contest sits on that thin a scale. No support turned up for “three years old is the sweet spot,” either — even restricted to the range the data actually backs, year 4 and year 5 both kept beating year 3. Where the true cheapest age lands, though, is a question outside this calculation’s data range (see Section 5). Over a 10-year horizon, trading in every 5 years instead of keeping one car the whole time costs an extra ₩2.32M (≈$1,589) for new cars, ₩1.95M (≈$1,336) for used.
The most interesting reversal is around age. On the central insurance estimate this piece trusts most, there’s no age at which renting wins — buying beats renting whether you’re in your 20s or 30s. But plug in another insurance-comparison site’s early-20s estimate (as high as ₩2.80M/yr, ≈$1,918), and new flips to ₩7.17M (≈$4,911) more expensive than renting, used to ₩4.64M (≈$3,178) more expensive. Which means the answer to “at what age does buying start winning” isn’t really a math problem — it’s a question of which insurer’s quote you happened to get. Worth plugging your own number in above and checking.
Renting carries one risk buying doesn’t: forecasting your own mileage years in advance, with a fee if you contract for too little and no refund if you contract for too much. Depreciation, breakdown, and resale risk genuinely transfer to the rental company — but mileage-forecast risk runs the other way, and it’s a risk that only exists because the rental contract exists in the first place. In the end, what this article ended up computing isn’t a verdict — it’s a price tag. ₩49,021 (≈$34) a month, versus buying new — that’s roughly what it costs to hand depreciation uncertainty, breakdown risk, and the upfront-capital burden off to a rental company. Whether that monthly number is worth it, and whether you’re willing to take on the mileage-forecast risk that rides along with the deal — those two calls are yours to make.
References
[1]: Hyundai Motor Company official price list, “2026 Elantra Price List” (individual consumption tax at 3.5%), https://www.hyundai.com/contents/repn-car/catalog/avante-2026-price.pdf — trim pricing (gasoline 1.6): Smart ₩20,340,000 / Modern ₩23,550,000 / Inspiration ₩27,170,000 / N Line ₩28,060,000
[2]: ino1.com, “Hyundai Elantra CN7 Used-Buying Guide: Pre-Facelift vs. Post-Facelift Pricing and Recommended Model Years” (현대 아반떼 CN7 중고 구매 가이드), https://ino1.com/car/avante-cn7-used/
[3]: Ica (actioncar), “Elantra Long-Term Rental Price List and Monthly-Rate Comparison” (아반떼 장기렌트 가격표 및 월렌트료 비교 분석), https://actioncar.co.kr/rental/179
[4]: Hankook Ilbo, “Fintech firm Habit Factory analysis: ‘Women in their 30s–60s pay more for auto insurance than men’” (핀테크 해빗팩토리 분석), October 22, 2024, https://www.hankookilbo.com/News/Read/A2024102215180003255
[5]: The General Insurance Association of Korea’s real-time auto-insurance comparison portal was folded into Bohum Damoa (보험다모아), a unified comparison platform, in July 2016, effectively ending it as a standalone tool. Since then, published age-bracket average premiums vary by more than 2x between research sources for drivers in their 20s (for example, comparison sites such as normen.co.kr estimate ₩2,000,000–₩2,800,000 for early-20s drivers). Background on the Bohum Damoa platform itself: Financial Services Commission press release, “Bohum Damoa Now Lets Users Compare Real Auto-Insurance Premiums, Adds Mobile Service” (보험다모아, 자동차보험 실제보험료 비교), https://www.fsc.go.kr/no010101/72213 (this release does not itself date the 2016 shutdown of the older portal)
[6]: Korea Law Information Center, Local Tax Act, Chapter 7 (Acquisition Tax), Article 12 — Korea’s acquisition tax (a one-time transfer tax on vehicle purchase, roughly analogous to US state sales/registration tax) is a flat 7% for both new and used passenger cars, https://www.law.go.kr/법령/지방세법
[7]: Seocho District Office, “Guide to Vehicle (Ownership) Tax” — Korea’s annual road tax is assessed per cc of engine displacement rather than by vehicle value, with a discount that grows each year starting in year 3, https://www.seocho.go.kr/site/tax/02/10201050000002023050810.jsp
[8]: Chunsik.com, “How Much Does It Really Cost to Maintain a Hyundai Elantra Monthly? A Realistic Breakdown” (현대 아반떼 월 유지 비용 분석), https://chunsik.com/현대-아반떼-월-유지-비용-얼마나-들까-현실적인-분석/
[9]: Shinhan Card, “Long-Term Rental Car Terms and Conditions” (자동차 장기 렌터카 약관) — excess-mileage settlement fees vary by rental company (e.g., ₩200/km for domestic models in some contracts); this article conservatively applies ₩150/km for a domestic compact-class baseline, https://www.shinhancard.com/pconts/html/helpdesk/terms/terms21/1186885_1223.html
[10]: Bank of Korea Economic Statistics System (ECOS), weighted-average time-deposit interest rate at deposit banks, https://ecos.bok.or.kr — this article’s opportunity-cost calculation uses simple-interest approximation; compounding would add roughly ₩200,000–₩250,000 (≈$137–$171) more over 5 years
[11]: carsize.co.kr, “Comparing Auto-Loan Interest Rates: 2026 Bank and Capital-Company Lowest Rates” (자동차 할부 이자율 비교와 계산법), https://carsize.co.kr/car-installment-interest-rate-comparison-calculation/
[12]: Namu Wiki, “Hyundai Elantra/7th Generation” (현대 아반떼/7세대) — 2023 and 2024 model-year gasoline Modern-trim pricing, https://namu.wiki/w/현대 아반떼/7세대
[13]: Yuca Post, “Hyundai and Kia’s 2026-Model-Year Price Update Averages a 2.56% Increase” (현대차·기아 26년형 연식변경 가격 평균 2.56% 인상), https://v.daum.net/v/5jeniaBWyM
[14]: Federal Reserve Board, H.10 Foreign Exchange Rates release, week of July 27, 2026, reporting a July 24, 2026 KRW/USD rate of ₩1,460.76 — the won strengthened sharply against the dollar through July 2026 (roughly ₩1,550 in early July to the ₩1,435–1,440 range by month’s end), so this article rounds to ₩1,460 ≈ $1 for all conversions, https://www.federalreserve.gov/releases/h10/current/