There are 136 flights a week from Seoul Incheon to Los Angeles right now[1]. Each one seats 269 people, so about 36,000 seats cross the Pacific on that single city pair every week.
How many of them have to sell before the airplane breaks even?
There’s a barstool answer that follows this question around. “Business class alone already covers it. Economy is just gravy.” Twenty-four seats up front, the story goes, carry all 245 seats behind them. It sounds plausible. A business ticket does cost three or four times an economy one.
But “three or four times” is exactly what makes it suspicious. A business seat also takes up far more of the floor than an economy seat does. Three or four times more, in fact. Which means this claim is a much closer race than it sounds.
INPUT
First, what we’re counting and how. The case study is one one-way Korean Air flight from Incheon (ICN) to Los Angeles (LAX). The aircraft is a Boeing 787-9 with 24 Prestige (business) seats and 245 economy seats, 269 total[2]. The distance is about 9,600 km (5,965 miles) and the average block time — gate to gate — is 11 hours 19 minutes[1].
We use one leg rather than a round trip for a simple reason: an airplane launches one flight at a time, and spends money one flight at a time.
All figures below are in US dollars, converted at ₩1,420 per dollar, the rate prevailing in August 2026[5].
Money going out
| Variable | Value | Basis |
|---|---|---|
| Fuel burned | 63 t (metric tons) | 787-9 burns ~5.5 t/hour[3] × 11.3 h, plus taxi and reserves |
| Jet fuel price | $943/t | About $120/barrel[4]; 1 t ≈ 7.86 barrels |
| Flight crew | 4 | Over 11 hours, so an augmented crew is required |
| Cabin crew | 10 | Standard for 269 seats |
| Aircraft ownership | Lease-equivalent | ~$900k/month for a 787-9[6], prorated over 13 block hours a day |
| Maintenance | $2,000 per flight hour | Industry estimate for widebodies |
| Airport and ATC fees | Both ends | ICN landing and parking fees, LAX landing fees, navigation charges[14] |
| Sales and admin | 18% of direct costs | Reservation systems, agency commissions, head-office overhead |
Money coming in
This is the part that’s easy to get wrong. You cannot use published fares. What actually gets collected is far lower, because the cabin is a mix of award tickets, group fares, agency discounts, and sale seats.
So we use realized yield instead: the revenue an airline actually booked, divided by the distance its actual passengers actually flew. Korean Air reported an international yield of ₩128/km in Q1 2026 and ₩138/km in Q2[7], or roughly 9.0 to 9.7 US cents per kilometer.
That figure can’t be dropped straight onto a transpacific route, though. Yield per kilometer falls as distance rises — a two-hour ticket to Tokyo earns far more per kilometer than an eleven-hour ticket to Los Angeles. Applying the usual long-haul taper, we’ll use ₩100/km ($0.070/km), which works out to $676 per passenger.
| Variable | Value | Basis |
|---|---|---|
| Average realized fare | $676/passenger | $0.070/km × 9,600 km |
| Business-to-economy fare ratio | 3.5 : 1 | On realized fares, not published ones |
| Load factor | 85% business, 87% economy | Korean Air international load factor ran 87–88.5%[7] |
| Cargo loaded | 11 t | Lower hold space left over after passenger baggage |
| Realized cargo yield | $0.432/tonne-km | Korean Air H1 2026 average (Q1 $0.370, Q2 $0.495)[12] |
That last pair may be unfamiliar. A passenger jet is also a freighter. The hold beneath your feet doesn’t just carry suitcases; it carries paying freight, which the industry calls belly cargo. Leave it out and the answer changes badly. On the transpacific in particular, this is not a rounding error — Korean Air is one of the world’s largest air cargo carriers, and roughly a quarter of the company’s revenue comes from freight.
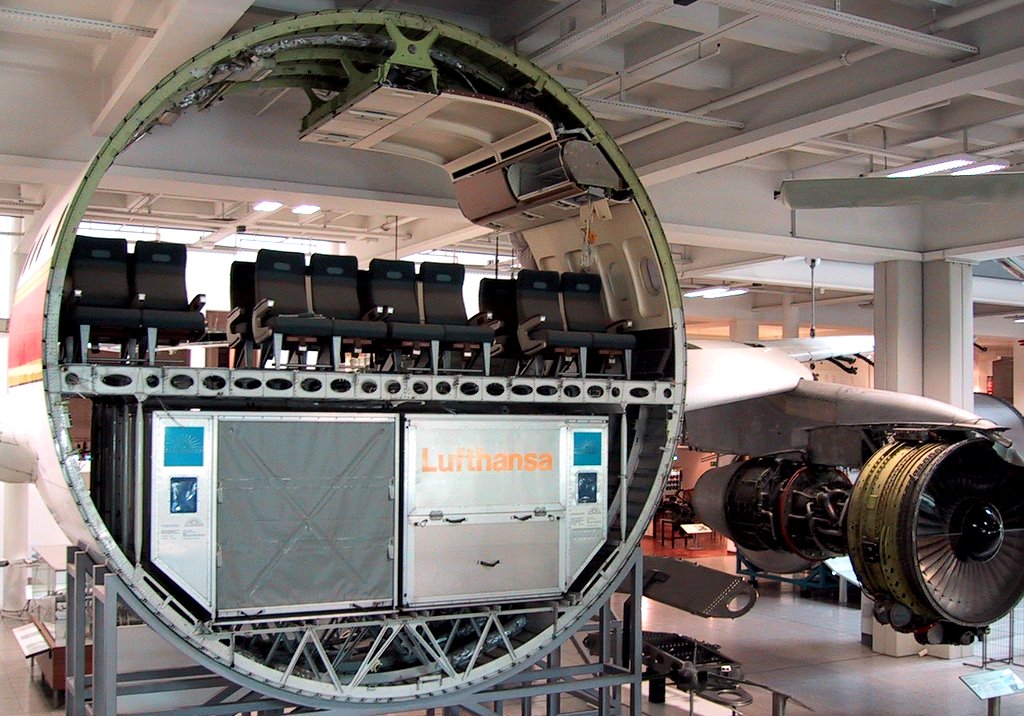

Cargo gets the realized-yield treatment too. Korean Air reports freight pricing in won per tonne-kilometer, and that number spiked in 2026: from ₩525 in Q1 to ₩703 in Q2, up 42%[12]. Semiconductor and AI-hardware exports made Korea–US the hottest lane in the market. The half-year average of ₩614 ($0.432) works out to $4.15 per kilogram flown from Incheon to Los Angeles.
Every number here is reconstructed from public sources. It is an estimate, not an airline’s internal cost sheet, and it is not a verdict on whether any particular route makes money.
FORMULA
Step 1 — What it costs to launch this airplane once
Start with fuel.
Add the rest:
| Item | Cost | Share |
|---|---|---|
| Fuel | $59,400 | 35.3% |
| Crew | $12,700 | 7.5% |
| Aircraft ownership | $26,800 | 15.9% |
| Maintenance | $23,200 | 13.8% |
| Airport and ATC fees | $12,000 | 7.1% |
| Catering and passenger service | $8,500 | 5.1% |
| Direct cost subtotal | $142,600 | |
| Sales and admin (18%) | $25,700 | 15.3% |
| Total | $168,300 | 100% |
Two sanity checks before going further.
First, cost per available seat-kilometer — CASK, the industry’s standard unit — comes to cents. That sits squarely inside the normal band for a long-haul widebody.
Second, fuel is 35.3% of the total. IATA puts the 2026 industry-wide figure at 31.4%[8]. Long-haul flying should come in above the average, since it burns proportionally more fuel and pays proportionally fewer airport fees per kilometer. It checks out.
It’s worth noting what kind of year 2026 is. IATA expects jet fuel to average $152 a barrel this year, up 69% from $90 in 2025[8]. The answer below is hostage to that number.
Step 2 — A seat doesn’t buy a spot, it buys floor area
Now we have to split $168,300 among the seats. Divide by 269?
No. A business seat consumes far more of the cabin floor. Put the two cabins side by side and you can see it before doing any arithmetic.
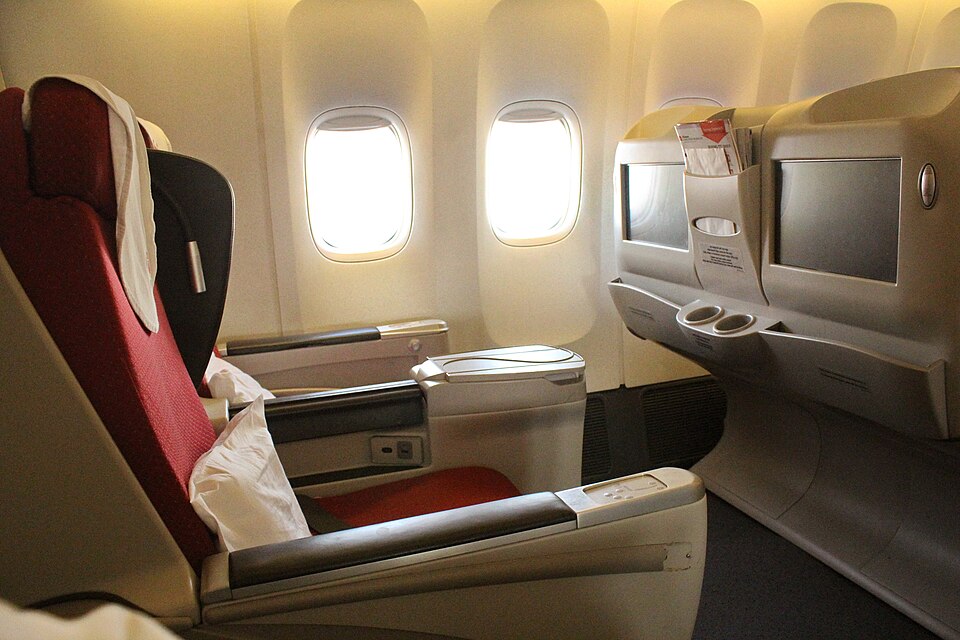

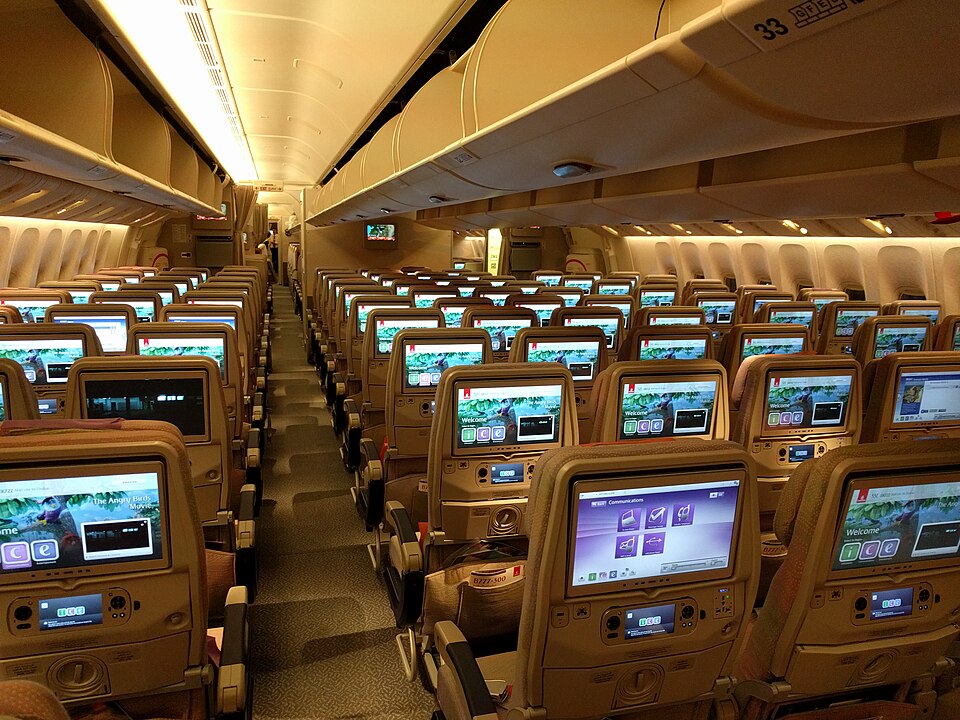

Now for exactly how much more. Seat pitch is 75 inches in Prestige and 33 inches in economy[2]. Width is less obvious. The fuselage is the same width everywhere, but Prestige fits 6 seats per row (2-2-2) while economy fits 9 (3-3-3). Fewer seats in a row means each seat is wider, so the width ratio is 9 ÷ 6 = 1.5.
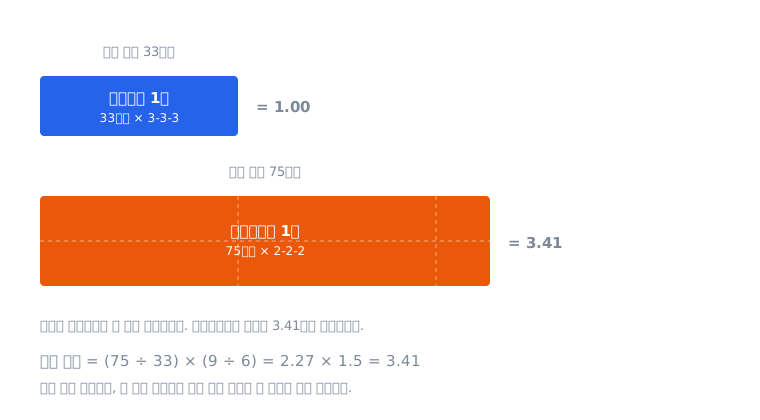
One business seat takes the floor of 3.41 economy seats, so it should carry 3.41 times the cost. Counting the whole cabin in economy-seat units:
It’s a 269-seat airplane, but for splitting costs it’s a 326.8-unit airplane.
Cargo revenue comes off the top first, since passengers shouldn’t be charged for what the hold earns.
An economy seat costs $375 to fly one way. A business seat costs $1,279.
Step 3 — Testing the claim: can business class alone cover it?
Split the realized fares by cabin. At the stated load factors, 20 business and 213 economy passengers board — 233 people, who together paid 233 × $676 = $157,500. With a 3.5 : 1 fare ratio and economy fare :
So $557 one way in economy, $1,950 in business.
Now run the claim exactly as stated. Fill every one of the 24 business seats:
That’s 28% of the cost of the flight. Add a full cargo hold at $45,600 and you reach $92,400 — still only 55%.
What if they all paid the published fare? Take a fully flexible business fare of $4,230 one way and sell all 24 seats at it, and you get $101,520 — 60% of the trip cost.
In other words, even with every assumption pushed as far in its favor as it will go, business class alone cannot cover two-thirds of the flight. The claim doesn’t survive.
Couldn’t they just add more business seats? Not really. The cabin floor is fixed at 326.8 units, so every business seat you add costs you 3.41 economy seats. What grows up front shrinks in back.
But push it all the way and see what happens. For the claim to come true, 90% of the cabin floor has to go to business — 86 business seats and 33 economy seats. For reference, the real Korean Air 787-9 gives business 25% of its floor.
The calculator below lets you slide that ratio yourself.
Step 4 — So how many people does it take?
Here’s the actual question. Break-even means:
where is business passengers and is economy passengers. Hold business at its usual 20 and solve for :
171 people. Sixty-four percent of the cabin.
Is that a believable number? IATA calculated the industry’s break-even weight load factor at 63.9% for 2024[9]. The two land almost on top of each other, but one counts seats and the other counts payload weight, so agreement that close is mostly luck. Treat it as an order-of-magnitude check, nothing more.
Meanwhile the actual 2026 passenger load factor is forecast at 84.0%[8], and Korean Air’s international routes ran 87–88.5%[7]. The airplane flies with about 20 points of cushion above the line.
Step 5 — Then who is carrying whom?
The claim is dead. But a question survives it: is business class at least paying more than its own floor space costs?
We have the cost from Step 2 and the fare from Step 3, so divide.
Business returns 1.52 times its cost, economy 1.49. A 2.6% difference.
That 2.6% isn’t a coincidence. Take the ratio of the two margins and the costs cancel out entirely, leaving nothing but the fare ratio divided by the floor-area ratio:
So which cabin is the better business comes down to a single inequality:
If the fare ratio beats the floor-area ratio, business wins. Plug in the numbers: 3.50 against 3.41. Business wins, but not by enough to brag about.
So why not convert the whole airplane to business class?
If business wins, why doesn’t the airline lean all the way into it? Write revenue at full occupancy as a function of the floor share and the answer appears:
It’s linear in , with a positive slope — so yes, more business always earns more. But go the whole way, from 25% of the floor to 100%, and here is what you actually gain:
Two percent. Whatever cabin layout you choose, the revenue barely moves. The optimum isn’t a sharp peak; it’s a wide plateau.
Which means the layout isn’t decided by floor-area arithmetic at all. It’s decided by demand. Roughly 20 people a day will pay $1,950 to fly Incheon–Los Angeles up front. Stretch that cabin to 86 seats and you have to discount to fill them — and once the fare ratio slips below 3.41, the inequality above flips against you.
So the airline adds business seats one at a time and stops at the point where the fare needed to fill the marginal seat equals the floor-area ratio. The 3.50 ≈ 3.41 we measured is exactly where that optimization came to rest.
Worth keeping in mind when you play with the calculator above: sliding the floor share to 90% does make the claim come true, but only if all 86 business seats sell at $1,950. No route has that much demand.
And 2.6% sits inside this article’s own error bars. Move the fare ratio from 3.5 to 3.3 and the ranking flips. The honest conclusion is this: the two cabins are being sold at very nearly the same margin.
The airline is not charging its front-cabin passengers some magic premium. It is selling them a bigger piece of floor and charging accordingly.
Step 6 — What happens with no business class at all?
There’s one more way to see that the barstool claim has the causality backwards: airlines with zero business seats also make money.
Jin Air is Korean Air’s low-cost subsidiary — roughly what Spirit or Frontier is to a US legacy carrier, except that it flies widebodies. Its Boeing 777-200ER is configured with 393 seats, all economy, in a 3-4-3 layout[10]. What happens if we put that airplane on ICN–LAX?
The 777-200ER drinks far more fuel than a 787-9: 6.63 t/hour[11], about 78 t for the leg. But it’s an older airframe, so it’s cheap to own, its food is sold rather than served, and its head-office overhead is thinner.
| Item | Jin Air 777-200ER | Korean Air 787-9 |
|---|---|---|
| Seats | 393 (all economy) | 269 (24 + 245) |
| Fuel | $73,600 | $59,400 |
| Crew | $10,200 | $12,700 |
| Aircraft ownership | $7,400 | $26,800 |
| Maintenance | $32,400 | $23,200 |
| Airport and ATC fees | $13,400 | $12,000 |
| Catering | $2,100 | $8,500 |
| Sales and admin | $16,700 (12%) | $25,700 (18%) |
| Total trip cost | $155,800 | $168,300 |
| Cargo revenue | $41,500 | $45,600 |
| Passenger burden ÷ seats | $291 | $375 (economy seat) |
Per seat, $291 against $375 — the low-cost carrier is 22% cheaper. Packing the seats in works.
But the fares come down with them. Put Jin Air’s economy fare at $387, about 70% of Korean Air’s:
The low-cost carrier’s break-even load factor is higher, not lower. Korean Air 64%, Jin Air 75%.
Costs fell 22%, but fares fell 30%. Cramming seats in lowers the cost of each one, yet you have to discount those seats to fill them — so you end up needing to fill more of them.
This isn’t only true on paper. Jin Air’s 777-200ERs once flew as far as Honolulu and Cairns. Since 2023 they’ve been redeployed to Narita, Kansai, and Taipei — short, dense routes where the seats always sell[10].
Step 7 — If cargo is that good, why not just fly a freighter?
By now something looks off. Eleven tonnes in the hold earned $45,600. The 20 business passengers who actually showed up paid $39,000. Freight doesn’t eat, doesn’t recline, and never asks for a blanket. So why carry people at all?
To answer that you have to look at marginal cost — what those 11 tonnes cost on top of a flight that was leaving anyway.
The airplane departs because of the passengers. The pilots, the landing fees, the gate, and almost all of the fuel are already paid for. Adding 11 tonnes costs exactly two things: the extra fuel to haul the weight, and the labor to load and unload it.
A 787-9 cruises at roughly 200 tonnes. Add 11 and it’s 5.5% heavier, which costs about 3.9% more fuel. Take 3.9% of 63 tonnes and you get 2.5 tonnes.
Spend $3,700, collect $45,600. Belly cargo is very nearly free money.
Now the freighter. Korean Air flies the Boeing 777F: 102 tonnes maximum payload, with a practical limit of about 95 tonnes at this range[13]. Apply the 71.3% cargo load factor Korean Air actually reported[12] and it carries 67.7 tonnes.
| Item | 777F freighter | 787-9 passenger |
|---|---|---|
| Fuel (82 t / 63 t) | $77,300 | $59,400 |
| Crew (pilots only / pilots + cabin) | $7,000 | $12,700 |
| Aircraft ownership | $38,300 | $26,800 |
| Maintenance | $27,600 | $23,200 |
| Airport and ATC fees | $16,400 | $12,000 |
| Cargo handling / catering | $8,100 | $8,500 |
| Sales and admin (18%) | $31,400 | $25,700 |
| Total trip cost | $206,100 | $168,300 |
| Revenue | $281,000 (67.7 t) | — |
12.4× collapses to 1.36×.
Same cargo, same rate, same route — and a ninefold difference in margin. The freighter has to pay for the airplane, the pilots, the landing fees, and every drop of fuel out of cargo revenue alone. It also carries a handicap the passenger jet doesn’t: freight schedules cluster overnight, so a freighter flies fewer hours per day and each departure absorbs more of the monthly lease. That’s why the freighter’s ownership line above is higher than the passenger jet’s despite the older airframe.
Which gives us the real answer. The hold is a good deal not because it’s cargo, but because it’s leftover space on an airplane that was already leaving. What’s free isn’t the freight — it’s the room.
So why do freighters exist at all? Volume.
| Belly cargo | 777F freighter | |
|---|---|---|
| Payload carried | 11 t | 67.7 t |
| Margin multiple | 12.4× | 1.36× |
| Profit per departure | $42,000 | $74,900 |
The belly wins on margin by a factor of nine, but it can only take 11 tonnes — the hold is whatever is left after the suitcases, and that space is fixed. The freighter earns a thin margin on six times the freight, and thin times six still wins on the bottom line.
And that gap is the last contrast worth drawing. Up in the cabin, the two classes met within 2.6% of each other. Floor can be moved toward whichever cabin pays better, so over time the margins converged. The hold can’t do that. It’s the space left over after the suitcases, so its size is fixed — and a 12.4× gap simply sits there, visible and unreachable.
The cabin found its balance. The hold ran into a wall. Where the numbers look balanced, there was room to move; where they don’t, something was holding them still.
OUTPUT
To break even from Incheon to Los Angeles, a 269-seat Boeing 787-9 needs about 171 people on board. Sixty-four percent of the cabin. Twenty in business, 151 in economy, plus 11 tonnes of freight riding in the dark below them.
“Business class alone covers it” is not true. Sell all 24 seats at the full published fare and you have 60% of the cost. Fill the cargo hold too and you’re at 55% on realized fares. It doesn’t become true until 90% of the cabin floor belongs to business class. The 245 seats in back aren’t gravy; they’re most of the airplane’s revenue.
The more interesting part comes next. A business seat takes 3.41 times the floor and charges 3.50 times the fare. The margins land at 1.52 and 1.49 — 2.6% apart. Nobody is carrying anybody. Both cabins are paying almost exactly their own way per square foot. The seat up front is expensive because it’s big, not because it’s special.
That balance sits on a plateau, not a knife edge. Flip the cabin from 25% business to 100% and revenue moves by 2%. What decides the layout isn’t the floor-area arithmetic — it’s how many people will pay the fare.
The hold beneath them is the sharper version of the same lesson. Eleven tonnes cost $3,700 to carry and earn $45,600 — a 12.4× return. Put that same freight on a dedicated 777F and the multiple falls to 1.36. The hold isn’t a good deal because it’s cargo. It’s a good deal because it’s leftover space on an airplane that was already leaving. What’s free is the room, not the freight.
All of which is hostage to the fuel price. Jet fuel is up 69% this year, and running the same math at IATA’s $152-a-barrel forecast pushes the trip cost to $187,000 and the break-even load factor from 64% to 76% — from 171 passengers to roughly 200. Drag the fuel slider above and you can watch the cushion vanish in real time.
And none of this sits still. The balance is being re-struck right now.
This year alone, cargo yields jumped 42% in a single quarter[12] and jet fuel rose 69% in a year[8] — both sides of the inequality keep moving. And the airlines are moving floor to match. If you fly in the US you have already seen it happening: United has begun retrofitting cabins with fewer economy seats and more premium ones, American plans to grow its premium seating 50% by 2030, and Delta expects premium revenue to overtake main-cabin revenue this year[15].
Whenever the fare ratio runs even slightly above the floor-area ratio, moving floor forward pays. The 3.50 against 3.41 we measured — that 2.6% — is the “slightly.” The reason airlines around the world are currently tearing out seats and bolting in bigger ones is sitting in the second decimal place.
One last thing. The $45,600 that hold earns is more than the $39,000 paid by the 20 business passengers who actually boarded. While the people up front are choosing between the bibimbap and the beef, the highest-paying customer on the airplane is crossing the Pacific in the dark, with no window and no opinion about the wine.
References
[1]: Korean Air, Flights from Seoul to Los Angeles — 136 weekly flights, average flight time 11 h 19 min. https://www.koreanair.com/flights/en/flights-from-seoul-to-los-angeles
[2]: Korean Air, B787-9 (269 seats) seat map — 24 Prestige Suites (2-2-2, 75-inch pitch), 245 economy (3-3-3, 33-inch pitch). https://www.koreanair.com/jp/en/in-flight/aircraft/b787/9-269/seat-map
[3]: Boeing 787-9 cruise fuel burn. Published figures vary widely (4.5–5.9 t/hour), so this article uses 5.5 t/h, near the middle. Working backwards from the manufacturer’s stated efficiency (2.5 L per passenger per 100 km at 294 seats) gives about 56 t for the leg, but that is a best-case, full-cabin figure, so 63 t is used here to allow for taxi and reserve fuel.
[4]: IATA, Jet Fuel Price Monitor — $116.63 per barrel as of 1 July 2026. https://www.iata.org/en/publications/economics/fuel-monitor/
[5]: USD/KRW exchange rate of ₩1,420 (August 2026). Bank of Korea Economic Statistics System (ECOS), daily base rate. https://ecos.bok.or.kr
[6]: IBA, Aircraft Values and Lease Rates — about $1.05 million a month for a new Boeing 787-9. This article uses $900k to reflect fleet age. https://www.iba.aero/resources/articles/aircraft-values-lease-rates-september-2024/
[7]: Korean Air quarterly results, 2026 — international passenger yield of ₩128/km in Q1 and ₩138/km in Q2, load factor 87.1–88.5%. Hana Securities and iM Securities company reports, April and July 2026.
[8]: IATA, Global Outlook for Air Transport: Energy in Crisis (June 2026) — jet fuel forecast at $152/barrel for 2026, up 69% from $90 in 2025; fuel at 31.4% of operating expenses; passenger load factor 84.0%; operating margin 4.1%. https://www.iata.org/en/pressroom/2026-releases/06-07-middle-east-disruptions-high-fuel-prices-halve-airline-industry-profitability/
[9]: IATA, Industry Statistics Fact Sheet (June 2024) — break-even weight load factor of 63.9% for 2024 against an actual passenger load factor of 84.2%. https://www.iata.org/en/iata-repository/publications/economic-reports/industry-statistics-fact-sheet---june-2024/
[10]: Jin Air, Fleet — Boeing 777-200ER in a single-class 393-seat (3-4-3) configuration, withdrawn from long-haul flying after 2023 and redeployed to short, high-demand routes. https://www.jinair.com/company/aircraft
[11]: Boeing 777-200ER fuel burn of about 6,630 kg/hour. The roughly 20% gap against the 787-9 comes down to a generational difference in airframe and engine technology — composite structure and higher-bypass engines.
[12]: Korean Air quarterly results, 2026 — cargo yield of ₩525/tonne-km in Q1 and ₩703/tonne-km in Q2 (up 41.8% year on year), cargo load factor 71.3%. Hana Securities and iM Securities company reports, April and July 2026. This article uses the half-year average of ₩614/tonne-km ($0.432).
[13]: Boeing 777F specifications — 102 t maximum payload, cruise fuel burn of 6,800–7,200 kg/hour. Incheon–Los Angeles exceeds the full-payload range (roughly 9,200 km), so this article lowers the practical payload to 95 t. Ownership cost is a $1.0 million monthly lease prorated over 10 block hours a day; freighters fly fewer hours daily than passenger aircraft because air cargo schedules cluster overnight.
[14]: Incheon International Airport Corporation, Airport Facility Charges, and Los Angeles World Airports, Landing Fee Schedule — basis for landing, parking, lighting, and navigation charges. Landing fees scale with maximum takeoff weight, so the 777F (347.8 t) is charged about 1.4× the 787-9 (254 t).
[15]: Premium cabin expansion — United Airlines began retrofitting cabins with fewer economy seats and more premium ones (CNBC, 24 March 2026). https://www.cnbc.com/2026/03/24/united-airlines-premium-seats.html · American Airlines announced plans to grow premium seating capacity 50% by 2030 (American Airlines Newsroom, 2026). https://news.aa.com/news/news-details/2026/American-continues-retrofitting-fleet-to-offer-customers-more-premium-seating-than-ever-FLT-06/default.aspx · Delta expects premium revenue to exceed main-cabin revenue in 2026.