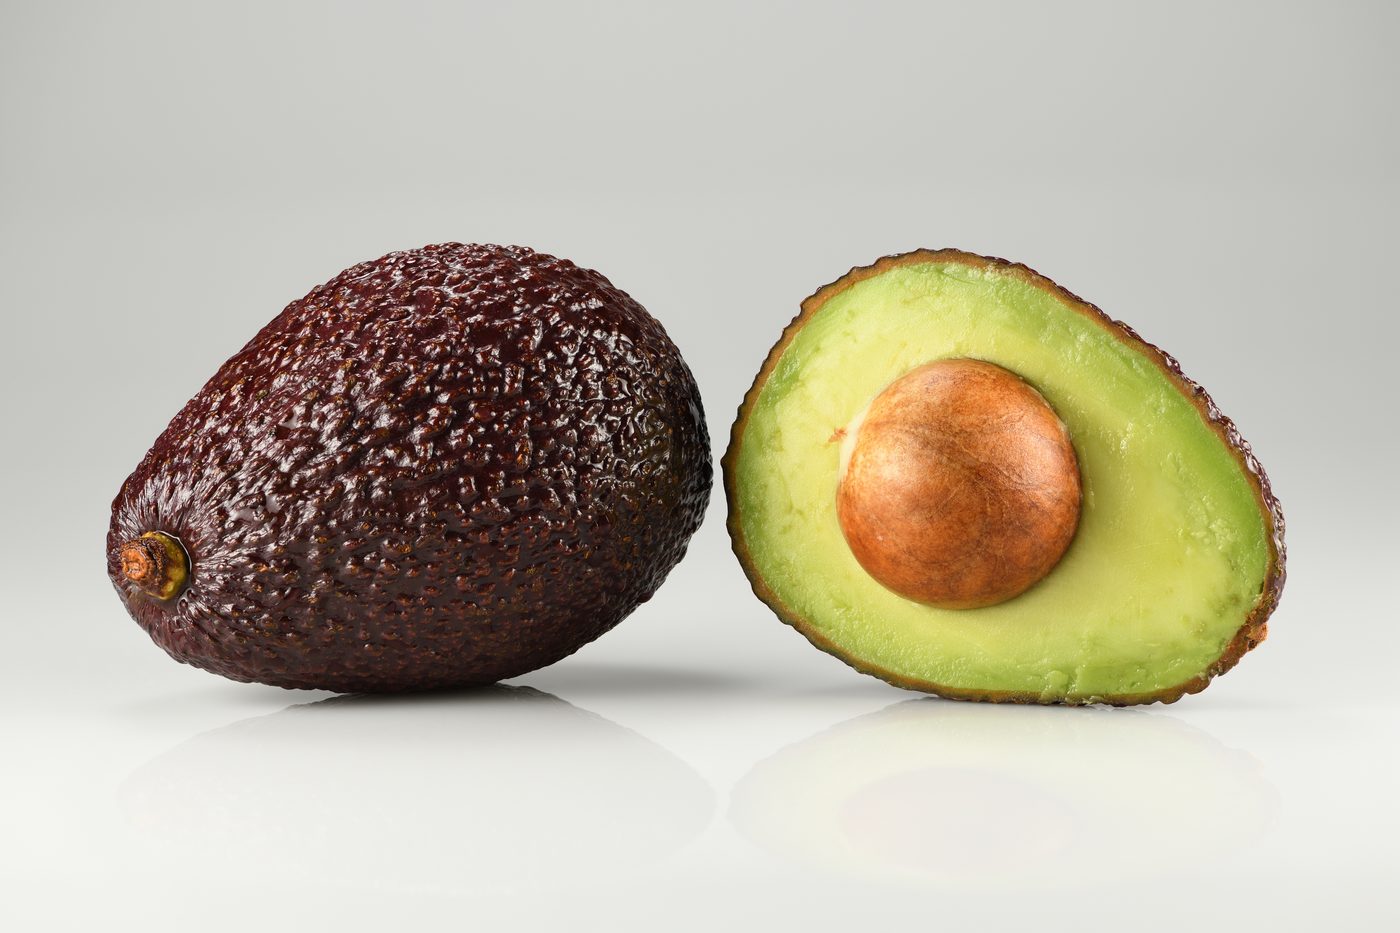
Reach for an avocado in the supermarket produce aisle, and it comes with a factoid stapled to it: growing this one fruit took 320 liters of water. That’s enough to fill an average bathtub (about 200 L) one and a half times over. You’ve seen some version of this number in documentaries, in Instagram infographics, everywhere a listicle needed a shocking statistic. But where does it actually come from?
This article dissects a single avocado (100 g of edible flesh) through three lenses. The first is water — how much water actually went into growing it? The second is carbon — how many kg of CO₂ did it produce from farm to import? The third is nutrition efficiency — how much this fruit “pays back” per liter of water and per milligram of potassium, ranked head-to-head against four other fruits.
We do the math ourselves on all three. And to get ahead of it: the calculation turns up a gap between the popular “one avocado = 200-320 liters” claim and what the primary data actually says. The reversal comes after the numbers.
This article is a calculation for fun, not medical or nutritional advice. Consult a registered dietitian or physician for actual dietary decisions.

INPUT
Functional Unit: 100 g of Edible Flesh
Environmental-impact calculations need a common yardstick to put different products on the same footing — that reference unit is called a “functional unit.” Water-footprint and carbon-footprint statistics conventionally use 1 kg of harvested fruit — pit, skin, and all, weighed whole — as their functional unit. But what you actually eat is the flesh alone. This article’s functional unit is 100 g of edible flesh.
For a Hass avocado, the pit accounts for roughly 16% of total weight, the skin about 12%, and the edible flesh about 72%.[13] For calculation convenience, this article adopts a slightly conservative center value of 70% edible-flesh ratio.
Whole-fruit weight corresponding to 100 g of flesh (for cross-checking):
Water Footprint Variables
A water footprint tallies the total volume of water — direct and indirect — consumed to make one unit of a product. It’s conventionally split into two or three layers. Green water is rainfall the crop absorbed directly from the soil. Blue water is irrigation drawn from rivers or groundwater. Some literature also reports a third, hypothetical component called grey water — the volume of clean water that would theoretically be needed to dilute fertilizer and pesticide runoff back down to a natural background concentration.[1]
The primary source for these statistics is Mekonnen & Hoekstra (2011), Value of Water Research Report Series No. 47, and its peer-reviewed journal version.[1] This article adopts that report’s green water + blue water total as its water-footprint baseline. It excludes grey water: this article could not independently reconfirm the relevant appendix row in the primary source, and a follow-up study, Sommaruga et al. (2021), reports avocado’s world-average water footprint as the green+blue sum alone — about 1,086 m³/t — without separately treating a grey-water component.[2] So this article drops grey water from the total and applies the same green+blue basis consistently across all five fruits.
| Variable | Value (world average, L/kg) | Basis |
|---|---|---|
| Green water | 849 | Center value, confirmed in source[1][2] |
| Blue water (world average) | 237 | Center value, confirmed in source[1][2] |
| Blue water, Chile extreme (Antofagasta, northern Chile) | 2,295 | Aggressive scenario — upper end of the regional range reported in the same source[1] |
| Total water footprint (world average, green+blue) | 1,086 | This article’s adopted baseline |
Here’s a discrepancy worth flagging. Social media and some outlets widely cite “2,000 liters of water per kilogram of avocado” — but the world average (green+blue) reported in the primary source is 1,086 L/kg, roughly half that. There’s no single confirmed cause, but the commonly cited larger figure looks like it originated from some mix of a specific arid growing region, a whole-fruit (pit-and-skin-included) basis, or an inefficient-irrigation scenario getting mislabeled and circulated as if it were the world average. This article uses the world-average figure the primary source actually reports.
For comparison, the world-average water footprints of four other fruits, pulled from the same source and the same basis (green+blue):[1]
| Fruit | Green (L/kg) | Blue (L/kg) | Total (L/kg, green+blue) |
|---|---|---|---|
| Avocado | 849 | 237 | 1,086 |
| Banana | 660 | 97 | 757 |
| Apple | 561 | 133 | 694 |
| Orange | 401 | 110 | 511 |
| Strawberry | 201 | 109 | 310 |
Carbon Footprint Variables
The carbon footprint is calculated across two stages: farming and transport. For the farming stage, this article’s primary source is a peer-reviewed paper covering the full export chain of avocados grown in South Africa and shipped to Europe.[3] The paper reports measured, stage-by-stage emissions for farming (diesel, electricity, fertilizer, pesticide), land transport (farm to port, 1,810 km), and sea transport (port to Rotterdam, 12,500 km).
A note for readers in the US: this life-cycle study tracks a South-Africa-to-Rotterdam route — a genuine European import scenario. If you’re in the United States, your avocado almost certainly took a shorter, different path. The large majority of avocados sold in the US are commonly reported to be grown in Michoacán, Mexico, and to arrive by refrigerated truck across a land border rather than by container ship across an ocean. That doesn’t invalidate the comparison this article makes below: sea vs. truck vs. air transport, held to an equivalent 12,500 km distance, is a comparison of modes, not of specific routes. It’s the mode of transport — not the country of origin — that ends up swinging the carbon number by an order of magnitude.
| Variable | Value | Basis |
|---|---|---|
| Farming carbon | 0.55 kgCO₂e/kg | Center value (measured, South Africa[3]). A Western Australia farm study reports 0.29–0.32[4]; a Peru farm study reports 0.50[5] — the range spans roughly 0.3–1.0 depending on growing region and electricity source |
| Land transport emission factor | 38.6 gCO₂e/(t·km) | Measured, South Africa study (69.91 kgCO₂e/t ÷ 1,810 km)[3] |
| Sea transport emission factor | 7.6 gCO₂e/(t·km) | Measured, South Africa study (94.85 kgCO₂e/t ÷ 12,500 km)[3] |
| Air transport emission factor | 1,130 gCO₂e/(t·km) | Poore & Nemecek (2018) / Ecoinvent v3.3 generic air-freight factor[6] — not an avocado-specific measurement; a general fresh-produce air-freight average |
The air-transport factor is a stand-in: no avocado-specific primary LCA for air freight could be found, so the general air-cargo average was substituted. Worth flagging upfront — avocados actually have enough ripening slack that they’re overwhelmingly shipped by sea in practice, so the air-transport scenario is an exceptional worst case, not the norm.
Nutrition Variables
Calorie and potassium values per 100 g for all five fruits come from the USDA FoodData Central standard reference.[7][8][9][10][11]
| Fruit | Calories (kcal/100g) | Potassium (mg/100g) |
|---|---|---|
| Avocado | 167 | 507 |
| Banana | 89 | 358 |
| Apple | 52 | 107 |
| Orange | 47 | 181 |
| Strawberry | 32 | 153 |
FORMULA
Lens 1: Water Footprint — Which Avocado Are You Counting?
Step 1: Substituting the 100 g edible-flesh basis
A single avocado’s worth of 100 g edible flesh requires roughly 109 L of water (green+blue basis) — about 217 standard 500 mL bottles of water. That’s about half the “2,000 L/kg (≈200 L per fruit)” figure mentioned earlier.
For readers who think in gallons rather than liters: 109 L is about 28.8 US gallons — roughly two full cycles of a standard top-loading washing machine, or somewhere in the neighborhood of 460 eight-ounce drinking glasses.
Blue water’s share of the total:
In other words, the “actually pumped” water directly tied to irrigation conflicts is only a bit over one-fifth of the total; the remaining roughly 78% is rainfall (green water).
Step 2: Cross-check on a whole-fruit basis
Calculated on whole-fruit weight ( g) rather than flesh alone:
The gap between the flesh basis (108.6 L) and the whole-fruit basis (155.2 L) is a factor of 1.43 — exactly . Whether “one avocado’s water footprint” includes the pit and skin or not, on its own, swings the answer by more than 40%.
Step 3: Where does the “2,000 L” myth come from?
Why does the world-average total the source reports (1,086 L/kg) differ from the “2,000 L/kg” figure circulating publicly? The most plausible explanation, circumstantially, is that a regional extreme has been mistaken for a global average. In fact, blue water alone in the severely water-stressed Antofagasta region of northern Chile runs about 2,295 L/kg — roughly 9.7 times the world average of 237.[1] Substitute that extreme value for the world-average blue water (237):
314 L — now we’re finally in the same ballpark as the “320 liters” folk figure. But this number isn’t a world average; it’s the extreme case for one specific water-scarce growing region. In this scenario, blue water’s share jumps to , so irrigation water dominates the total. The “avocados are stealing our water” narrative is, more precisely, a story about this region and this blue water — not about avocados in general.
Chile’s avocado industry has, in fact, become an internationally reported flashpoint over water rights — most famously in the Petorca valley, several hundred kilometers south of Antofagasta, where journalists and human-rights groups have accused large-scale avocado plantations of diverting rivers and groundwater away from local communities.[14] The extreme blue-water figure used in this calculation comes from a different, even more arid part of Chile (Antofagasta), but it illustrates the same underlying mechanism that made Petorca international news: in a water-stressed growing zone, avocado’s blue-water footprint can swamp the world average by nearly an order of magnitude.
Fruit comparison:
| Fruit | World-average total water footprint (L/kg, green+blue) | Per 100 g (L) |
|---|---|---|
| Avocado | 1,086 | 108.6 |
| Banana | 757 | 75.7 |
| Apple | 694 | 69.4 |
| Orange | 511 | 51.1 |
| Strawberry | 310 | 31.0 |
In absolute terms, avocado uses the most water of the five fruits. That ranking doesn’t flip. The next lens is where things get complicated.
Lens 2: Carbon Footprint — Transport Beats Growing Region
Assume the same 12,500 km distance (the measured South-Africa-to-Rotterdam route) is covered by truck, ship, and plane respectively, and compare.
Land (truck, 12,500 km equivalent):
Sea (ship, 12,500 km measured):
Air (plane, 12,500 km equivalent):
Adding the farming carbon (0.55 kgCO₂e/kg) on a 100 g flesh basis:
| Transport mode | Combined (kgCO₂e/kg) | Per fruit (kgCO₂e, m=100g) |
|---|---|---|
| Sea | 0.55 + 0.095 = 0.645 | 0.065 |
| Land (truck) | 0.55 + 0.483 = 1.033 | 0.103 |
| Air | 0.55 + 14.125 = 14.675 | 1.468 |
First thing to notice: over the same distance, a truck (0.103 kgCO₂e) emits about 1.6 times more than a ship (0.065 kgCO₂e). That tracks, given trucking is roughly 5 times more carbon-intensive per km than shipping. But the order of magnitude doesn’t change.
Second, and far more dramatic, is the reversal that air transport produces.
Looking at the transport mode alone, air emits roughly 149 times more than sea. That’s close to the frequently cited industry figure of “air transport is 145 times sea.”[12] Once you fold in farming carbon for the full footprint, the multiple drops to about 23x — still well into double digits. Whether the avocado was grown in South Africa, Mexico, or Peru (a farming-carbon spread of at most about 3x), that variation is dwarfed by the much bigger swing from “did it come by ship or by plane.”
Lens 3: Nutrition Efficiency — A Leaderboard per Liter of Water, per Milligram of Potassium
By absolute water footprint, avocado ranks first (uses the most). But switch the metric to “how much nutrition do you get back per liter of water,” and the leaderboard flips.
Substituting the world-average water footprint (green+blue basis) directly:
| Fruit | kcal/kg | K mg/kg | Total water footprint (L/kg, green+blue) | kcal/L | mg K/L |
|---|---|---|---|---|---|
| Avocado | 1,670 | 5,070 | 1,086 | 1.538 | 4.669 |
| Banana | 890 | 3,580 | 757 | 1.176 | 4.729 |
| Apple | 520 | 1,070 | 694 | 0.749 | 1.542 |
| Orange | 470 | 1,810 | 511 | 0.920 | 3.542 |
| Strawberry | 320 | 1,530 | 310 | 1.032 | 4.936 |
Calorie efficiency (kcal/L) ranking: avocado (1.538) > banana (1.176) > strawberry (1.032) > orange (0.920) > apple (0.749). Avocado — first in absolute water footprint — is also first out of five in calorie efficiency.
Potassium efficiency (mg K/L) ranking: strawberry (4.936) > banana (4.729) > avocado (4.669) > orange (3.542) > apple (1.542). This time it’s third — narrowly edged out by strawberry and banana, but still near the top.
That’s the exact opposite of avocado’s reputation as a water hog. Run the world-average numbers, and avocado isn’t anywhere near the bottom of the nutrition-efficiency leaderboard — it’s near the top.
But how robust is this ranking? The soft spot is exactly the growing-region issue from Lens 1. Substitute the Chile extreme (2,295) for the world-average blue water (237), and avocado’s total water footprint jumps to 3,144 L/kg (=849+2,295), so:
Calorie efficiency drops to 0.531 — dead last of the five (below even apple’s 0.749) — and potassium efficiency falls to 1.613, fourth place, just ahead of apple. The regional reversal from Lens 1 carries straight through and flips Lens 3’s ranking. The world-average avocado is an efficiency honor student; the same fruit grown in a water-stressed region gets a completely different report card.

But Why Does Avocado Get Singled Out — And Is It Okay to Eat It?
Get this far, and two questions remain: why avocado specifically gets tagged as an environmental villain, and whether that means it’s fine to keep eating it. This section answers only as much as the calculations above can actually support.
It’s Not the Fruit, It’s the Demand — Why Avocado Gets Singled Out
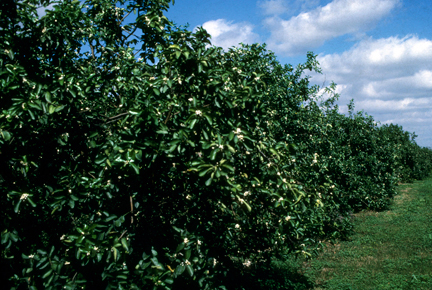
The Lens 1 and Lens 3 calculations show that, on a world-average per-kilogram basis, avocado’s water intensity isn’t unusually bad next to the other four fruits — if anything, it ranked first out of five in calorie efficiency. So why does it still get singled out as the bad fruit? The answer isn’t in the fruit’s own properties. It’s in the demand and profitability that surround it. Avocado is a high-value crop with unusually high revenue per hectare — which is exactly why it’s often nicknamed “green gold” — and that profitability, combined with an export-demand boom, is what concentrates cultivation into a handful of vulnerable growing regions and reshapes what that land and water get used for. Per-kilogram water and carbon metrics simply don’t capture this layer.
Michoacán, Mexico is the textbook case. Between 2001 and 2017, an estimated 20% of the state’s total forest loss has been linked directly to avocado orchard expansion, with pine-oak forest and fir (oyamel) forest disappearing in particular.[15] These orchards, expanding to chase demand, overlap with the overwintering habitat used every year by monarch butterflies migrating in from across North America — the Monarch Butterfly Biosphere Reserve — and researchers warn that expanding avocado monoculture is directly encroaching on it.[16] Field investigations by an international human-rights and environmental research organization found that virtually all of the forest conversion in this region was unpermitted under Mexican federal land-use law — in plain terms, illegal.[17] What cleared the forest wasn’t the fruit. It was the economic incentive to sell more of it.
In Chile’s Petorca valley, it was water that moved the same way forest did in Michoacán — a flashpoint international media have covered before.[14] A 1981 overhaul of Chile’s water code detached water rights from land ownership, turning them into an independently tradable form of property. When the avocado export boom took off in the 1990s, a small number of large agribusinesses bought up upstream water rights, cutting downstream smallholders and residents off from river access.[18] This isn’t a story about per-kilogram blue-water intensity — it’s a question of who had the capital to buy that water. Earlier, toggling the widget’s avocado growing region from world average (1,086 L/kg) to northern Chile’s Antofagasta (3,144 L/kg) sent the calorie-efficiency ranking falling from 1st to 5th. That same reversal is proof that a liter of blue water doesn’t carry the same real-world burden everywhere it’s drawn from. What pulled that water away wasn’t the avocado as a fruit — it was the demand, and the capital, that could afford to buy it.
So, Is It Okay to Keep Eating It?
This article isn’t going to land on “eat it” or “don’t.” The calculation supports exactly one claim: measured per fruit, avocado’s water and carbon intensity isn’t an outlier, and the harm isn’t something baked into the fruit itself — it’s a localized problem that demand creates in specific growing regions and watersheds. The lever that actually decides the outcome isn’t “which fruit” — it’s “what, how, and where that demand caused something to be grown.” Since a single change in water source alone can swing the result by several multiples, toggling the growing-region switch in the widget above and watching the number move between the world average and a water-stressed watershed gets you closer to the real picture than judging by a single country label ever could.
OUTPUT
Here are the three lenses side by side.
| Lens | Result (100 g flesh basis) | Notes |
|---|---|---|
| Water | ~109 L (world average, green+blue) | About half the popular figure (≈200-320 L); 314 L for the Chile-extreme growing region |
| Carbon — sea | ~0.065 kgCO₂e | Farming + sea transport |
| Carbon — air | ~1.47 kgCO₂e | ~23x sea (149x when comparing transport mode alone) |
| Nutrition efficiency | 1st in kcal/L, 3rd in potassium mg/L (of 5 fruits, world-average basis) | Falls to 5th and 4th respectively under the Chile-extreme growing region |
Three findings here run against intuition.
One. The popular claim of “200 to 320 liters of water per avocado” runs nearly double the world average the primary source actually reports (109 L, green+blue basis). The most plausible explanation, circumstantially, is that an extreme value from a specific water-scarce region like northern Chile (314 L) has been circulating as if it were the world average. An avocado isn’t born a water hog — it becomes one, or doesn’t, depending entirely on which neighborhood it grew up in.
Two. Transport mode (sea vs. air, a 23-149x swing) moves the carbon number far more than growing region does (South Africa, Western Australia, and Peru differ by at most about 3x). Fortunately, avocados don’t bruise or ripen too fast for sea transport, so most of them really do travel by ship. The air scenario is less a real-world default than a reference ceiling — a “here’s how bad it could get” upper bound.
Three. On the nutrition-efficiency leaderboard, avocado ranks first in calories and third in potassium out of five fruits — the exact opposite of its reputation as “the fruit that drinks the most water.” Per liter of water, it pays back nutrition near the top of the pack. But that report card assumes a world-average growing region. Sourced from northern Chile, the same avocado, carrying the exact same nutrition label, tumbles to near the bottom. In the end, the question “is avocado environmentally friendly” isn’t answered by the fruit’s name — it’s answered by the origin label on the sticker.
References
[1]: Mekonnen, M.M. & Hoekstra, A.Y. (2011), “The green, blue and grey water footprint of crops and derived crop products,” Hydrology and Earth System Sciences, 15, 1577–1600, https://doi.org/10.5194/hess-15-1577-2011 — original data: Value of Water Research Report Series No. 47, UNESCO-IHE, https://www.waterfootprint.org/resources/Mekonnen-Hoekstra-2011-WaterFootprintCrops.pdf — Appendix II world-average water footprints (green/blue, m³/t = L/kg): avocado 849/237 (total 1,086), banana 660/97 (total 757), apple 561/133 (total 694), orange 401/110 (total 511), strawberry 201/109 (total 310). Avocado blue-water regional range: 0 (Grenada) to 2,295 (Antofagasta, Chile) m³/t. This source also computes and reports a grey-water component, but this article could not independently reconfirm the relevant appendix row and so excluded it from the total (see [2] for detail on this decision).
[2]: Sommaruga, R. et al. (2021), “Avocado Production: Water Footprint and Socio-economic Implications,” EuroChoices, https://doi.org/10.1111/1746-692X.12289 — news summary: https://www.freshfruitportal.com/news/2022/01/06/avocado-production-water-footprint-and-socio-economic-implications/ — citing Mekonnen & Hoekstra (2011), presents avocado’s world-average water footprint as green water 849 m³/t, blue water 237 m³/t, combined approximately 1,086 m³/t (does not separately treat a grey-water component). This article follows this paper’s framing in adopting the green+blue combined figure as the water-footprint baseline.
[3]: Blaauw, R. et al. (2024), “Life Cycle Assessment of an Avocado: Grown in South Africa—Enjoyed in Europe,” Environmental Management, https://pmc.ncbi.nlm.nih.gov/articles/PMC11438827/ — farming stage 551.54 kgCO2e/t; land transport (Tzaneen→Cape Town, 1,810 km) 69.91 kgCO2e/t; sea transport (Cape Town→Rotterdam, 12,500 km) 94.85 kgCO2e/t.
[4]: d’Abbadie, C. & Akbari, S. (2023), WA Avocado Life Cycle Analysis (LCA), Department of Primary Industries and Regional Development (DPIRD), Perth, https://www.dpird.wa.gov.au/contentassets/c49f8d82a1444d68a398bd579adf5945/wa-avocado--life-cycle-analysis-lca.pdf — farming-stage carbon footprint 0.292–0.319 kgCO2e/kg (peak-production basis).
[5]: “Avocado production in different biomes throughout Peru: do differing cultivation practices translate into differences in environmental impacts?,” The International Journal of Life Cycle Assessment (Springer, 2025), https://link.springer.com/article/10.1007/s11367-025-02561-5 — Peru farming-stage average 0.50 kgCO2eq/kg.
[6]: Poore, J. & Nemecek, T. (2018), “Reducing food’s environmental impacts through producers and consumers,” Science, 360(6392), 987–992, https://doi.org/10.1126/science.aaq0216 — basis for the generic air-freight emission factor (approximately 1,130 gCO2e/t·km) derived from Ecoinvent v3.3.
[7]: USDA FoodData Central, “Avocados, raw, all commercial varieties,” FDC ID 171705, https://fdc.nal.usda.gov/food-details/171705/nutrients — per 100 g: 167 kcal, 507 mg potassium, 15.4 g fat, 6.8 g dietary fiber.
[8]: USDA FoodData Central, “Bananas, raw,” FDC ID 173944, https://fdc.nal.usda.gov/food-details/173944/nutrients — per 100 g: 89 kcal, 358 mg potassium.
[9]: USDA FoodData Central, “Apples, raw, with skin,” FDC ID 171688, https://fdc.nal.usda.gov/food-details/171688/nutrients — per 100 g: 52 kcal, 107 mg potassium.
[10]: USDA FoodData Central, “Oranges, raw, all commercial varieties,” FDC ID 169097 (estimated — this ID is consistently referenced across several secondary citations, but because the FDC site is JavaScript-rendered, this article could not directly cross-check the original page at the time of writing; the figures themselves, 47 kcal / 181 mg potassium, were independently cross-verified across multiple sources), https://fdc.nal.usda.gov/food-details/169097/nutrients — per 100 g: 47 kcal, 181 mg potassium.
[11]: USDA FoodData Central, “Strawberries, raw,” FDC ID 167762, https://fdc.nal.usda.gov/food-details/167762/nutrients — per 100 g: 32 kcal, 153 mg potassium.
[12]: World Avocado Organisation, “Carbon Footprint,” https://worldavocadoorganisation.com/sustainability/carbon-footprint — cites the International Chamber of Shipping’s comparison figure of “air transport approximately 145x sea transport.” Not an avocado-specific measured LCA; cited here as a cross-check, since it closely matches the roughly 149x figure this article derives independently from the South Africa sea-transport emission factor and the Poore & Nemecek (2018) generic air-freight factor.
[13]: UC Riverside, Avocado Variety Collection, “Avocado Ratios,” https://avocado.ucr.edu/avocado-ratios — Hass avocado weight ratios by part: pit 16%, skin 12%, flesh 72%.
[14]: CNN, “A rural town’s river vanished. Is Chile’s constitution to blame?” (Nov. 2022), https://www.cnn.com/2022/11/22/americas/chile-petorca-drought-intl-latam ; Environmental Justice Atlas, “The avocado agribusiness and the water crisis in Petorca, Valparaíso, Chile,” https://ejatlas.org/conflict/the-avocado-agribusiness-and-water-drought-in-petorca-chile — reporting on Chile’s water-rights code allowing large agribusiness landholders to hold river water rights, illegal water diversions documented by Chilean authorities, and resulting shortages for local residents in Petorca province. English-language orienting context added for this edition; not a source for this article’s numeric water-footprint figures, which remain sourced to [1] (Antofagasta region).
[15]: Arima, E.Y., Denvir, A., Young, K.R., González-Rodríguez, A. & García-Oliva, F. (2022), “Modelling avocado-driven deforestation in Michoacán, Mexico,” Environmental Research Letters, 17(3), 034015, https://doi.org/10.1088/1748-9326/ac5419 — estimates that roughly 20% of total forest loss in Michoacán state between 2001 and 2017 is associated with avocado orchard expansion; identifies pine-oak forest, mid-elevation broadleaf forest, and fir (oyamel) forest as particularly vulnerable to future expansion.
[16]: Sáenz-Ceja, J.E. & Pérez-Salicrup, D.R. (2025), “Expansion of avocado monoculture threatens the overwintering habitat of monarch butterflies in central Mexico,” Acta Oecologica, 128, https://www.sciencedirect.com/science/article/pii/S1146609X25000608 — finds that expanding avocado monoculture is encroaching on fir forest near the Monarch Butterfly Biosphere Reserve, directly threatening the monarchs’ overwintering habitat.
[17]: Climate Rights International (2023), “Unholy Guacamole: Deforestation, Water Capture, and Violence Behind Mexico’s Avocado Exports to the U.S. and Other Major Markets,” https://cri.org/reports/unholy-guacamole/ — field investigation finding that virtually all forest conversion for avocado cultivation in Michoacán and Jalisco states violates Mexican federal law (which prohibits unpermitted land-use change); also documents widespread illegal extraction of surface and groundwater at many growing sites.
[18]: Madariaga, A., Maillet, A. & Rozas, J. (2021), “Multilevel business power in environmental politics: the avocado boom and water scarcity in Chile,” Environmental Politics, 30(7), https://doi.org/10.1080/09644016.2021.1892981 — analyzes how Chile’s 1981 water code reform detached water rights from land ownership, making them an independently tradable property right, and how a small number of large agribusinesses concentrated purchases of upstream water rights in watersheds including Petorca following the 1990s avocado export boom, threatening downstream smallholders’ and residents’ water access.