Last time, we tried to fit two of every animal into the Ark’s stated dimensions (300×50×30 cubits).[1] This time we look at the water the Ark was floating on. Genesis 7 says the flood “covered all the high mountains under the whole heaven.”[2] That raises a question: if you poured enough fresh water onto the planet to cover the entire surface to that depth, what would happen to today’s salty ocean? And why is the ocean 3.5% salt to begin with?
This article doesn’t rule on whether the biblical narrative is historically true. Instead, it takes Genesis’s premise — “the whole earth was submerged” — as a given input and works out what that would do to ocean chemistry and fish physiology, the same thought-experiment posture we used in the first installment. This time we’ve added one more question: is the ocean we know today the same ocean that existed before the Flood, or a different one?
That question splits three ways, so we run three worldviews side by side. Model B keeps today’s geography fixed and treats the Flood as “the water rose, then drained back out.” Model A adopts the framework some young-earth creationism proponents (a minority theological-scientific position that holds the Earth is thousands, not billions, of years old) argue for — “catastrophic plate tectonics” — in which the Flood itself was the geological event that reshaped the continents and ocean basins into their current form. Model C steps back further and changes the question entirely: where did all that water come from in the first place, and was it fresh or salty? Up front: mainstream geology explains continental drift and mountain-building as gradual plate tectonics unfolding over hundreds of millions of years, and Models A and C both lean on premises outside that mainstream at points. We’ll flag “if you accept this framework” wherever it applies, and mean it every time.

INPUT
Shared variables — figures all three models rely on
Earth’s radius and surface area
We approximate Earth as a sphere with radius km.[3] This is the mean radius from the standard reference ellipsoid adopted by the International Union of Geodesy and Geophysics (IUGG), and it matches the polar-flattening-corrected precise value to within 0.3% — a solid, uncontested figure.
Today’s highest peak — Everest plus Genesis’s 15 cubits
Genesis 7:19-20 (KJV) says: “And the waters prevailed exceedingly upon the earth; and all the high hills, that were under the whole heaven, were covered. Fifteen cubits upward did the waters prevail; and the mountains were covered.”[2] A 2020 joint China–Nepal resurvey fixed Everest’s elevation at 8,849 m (29,032 ft).[4] The cubit (an ancient unit based on forearm length) is estimated across sources to run roughly 0.44–0.52 m (17–20 in);[5] we adopt a representative value of 0.46 m / 18 in (needs-assumption). Fifteen cubits comes to 6.9 m (0.0069 km, about 23 ft), so:
Current ocean volume, salinity, and density
The joint USGS/NOAA reference figure for total ocean volume is about km³ (roughly mi³).[6] Average salinity is 3.5% (35 PSU, “practical salinity units”),[7] surface seawater density averages 1,025 kg/m³ (about 64 lb/ft³), and fresh water is 1,000 kg/m³ (about 62.4 lb/ft³).[7] All four are solid, well-established figures.
Total atmospheric water vapor (Model B auxiliary input)
To check where all that water could have come from, we also need the total water vapor held in the atmosphere. Meteorologists call this “precipitable water” — the depth of the water layer you’d get if you condensed every drop of vapor in a column of air and dropped it straight to the ground. NASA/NOAA reanalysis climatology puts the global average at about 25 mm (roughly 1 inch), with regional swings from the 40 mm range near the equator to just a few mm at the poles.[8] We adopt the 25 mm representative value (needs-assumption).
Model A-only variables — pure assumptions with no data backing them
If you accept this framework: some creation-science proponents place Noah’s Flood at the moment a Pangaea-like supercontinent broke apart, arguing that catastrophic plate tectonics during and after the Flood caused oceanic plates to sink (subduct) rapidly, carving out today’s deep ocean basins and tall mountain ranges in a short span of time. The best-known version of this is geophysicist John Baumgardner’s “runaway subduction” model.[9] These sources make qualitative claims about the speed of tectonic change, but none of them offer a quantitative estimate of what fraction of today’s ocean basin existed before the Flood, or exactly how tall the pre-Flood mountains were. So the two variables below — (the pre-Flood basin’s fraction of today’s volume) and (the pre-Flood high-mountain elevation) — are pure, unsourced assumptions. We present them as ranges rather than single numbers.
| Symbol | Meaning | Value range | Confidence |
|---|---|---|---|
| pre-Flood ocean basin volume ÷ today’s ocean volume | 90 / 75 / 50 / 25 / 10% | contested (unsourced) | |
| pre-Flood highest-peak elevation | 8.856 / 3.0 / 2.0 / 1.0 km | contested (unsourced) |
Model C-only variables — where did that water actually come from
Models A and B both deal only with how much water covered the earth, and neither one touches the question of whether that water was originally fresh or salty. But Genesis isn’t actually silent on where the water came from — it names two specific reservoirs.
Genesis 1:6-7 (KJV), describing the second day of creation, says: “And God said, Let there be a firmament in the midst of the waters, and let it divide the waters from the waters… and God made the firmament, and divided the waters which were under the firmament from the waters which were above the firmament.”[20] Traditionally, “the waters above the firmament” have been read as a reservoir of vapor or ice sitting somewhere in or above the atmosphere. Then Genesis 7:11, marking the start of the Flood, says: “the same day were all the fountains of the great deep broken up, and the windows of heaven were opened” (already cited in Step 2 above).[14] “The windows of heaven” are commonly read as that upper reservoir pouring out; “the fountains of the great deep” as a subterranean or seafloor source breaking open.
The text doesn’t fully rule out a third possibility either: that the water was miraculously created from nothing (ex nihilo) rather than drawn from an existing reservoir. In that case its salinity is, by definition, an unknowable quantity, so no physical calculation is possible — we exclude this option from the math and note it only as a limitation. Model C below focuses on the two named reservoirs (the waters above the firmament, and the fountains of the deep). For readers wondering about the framing: this discussion of water sources isn’t meant to defend or dispute any particular denomination or doctrine — it’s simply taking Genesis’s own account of its water sources at face value.
| Symbol | Meaning | Value range | Confidence |
|---|---|---|---|
| salinity of the flood water (from the sky and/or the deep) | 0 / 0.5 / 1.0 / 1.5 / 2.0 / 2.5 / 3.0 / 3.5% | needs-assumption (internal textual inference, no quantitative source) |
Fish survival thresholds
Most freshwater fish start experiencing osmoregulatory stress (the physiological strain of managing the salt-concentration difference between their body and the surrounding water) at around 0.5% salinity (5 ppt) and above.[10] Stenohaline (narrow-salinity-tolerance) saltwater fish similarly begin to struggle below roughly 2.0–2.5% (20–25 ppt).[11] Both figures vary widely by species, so treat them as needs-assumption.
Variable summary table
| Variable | Value | Confidence |
|---|---|---|
| Earth’s surface area | km² (≈ mi²) | solid |
| Everest elevation | 8.849 km (29,032 ft) | solid |
| Cubit conversion | 0.46 m / 18 in (range 0.44–0.52 m) | needs-assumption |
| Current ocean volume | km³ | solid |
| Current salinity | 3.5% | solid |
| Seawater / fresh water density | 1,025 / 1,000 kg/m³ | solid |
| Atmospheric precipitable water | 25 mm (1 in) (range 15–45 mm) | needs-assumption |
| Basin ratio (Model A) | 90–10% | contested |
| Pre-Flood highest peak (Model A) | 8.856–1.0 km | contested |
| Flood-water salinity (Model C) | 0–3.5% | needs-assumption |
| Freshwater fish survival ceiling | ≈ 0.5% | needs-assumption |
| Saltwater fish survival floor | ≈ 2.0–2.5% | needs-assumption |
FORMULA
Step 0 — The shared anchor: today’s total ocean salt mass
All three models start from this number. Salt’s total mass is conserved no matter how much the water volume expands or contracts, so if we back-calculate the total salt mass from today’s volume, density, and salinity, we can reuse that number in any of the three scenarios.
Converting km³ to m³ (1 km³ = 10⁹ m³) and substituting:
Unit check: ✓ — this matches the order of magnitude commonly cited in oceanography for total global dissolved salt, roughly metric tons.[7] Order-of-magnitude sanity check passed. From here on we treat kg as a fixed anchor.
Model B — Keep today’s geography: temporary dilution, then recovery
Premise: leave today’s geography (Everest at 8.849 km, etc.) exactly as it is, and follow Genesis’s account that the whole planet was submerged in fresh water (chapter 7), then starting on day 150 the water began to recede (chapter 8), eventually returning to something like current sea levels.[12] This model requires no special theological premise — it runs entirely on the geography we already know.
Step 1 — Maximum dilution at day 40 (a snapshot)
The total volume of water needed to uniformly cover the globe to elevation is surface area times depth.
Subtracting the ocean volume already present tells us how much additional fresh water had to be poured in.
Assume this fresh water mixes into the existing salt water while the total salt mass stays fixed, and calculate the salinity at the point where 40 days of rain have fallen (Genesis 7:12, KJV: “and the rain was upon the earth forty days and forty nights”[13]).
Working out the denominator:
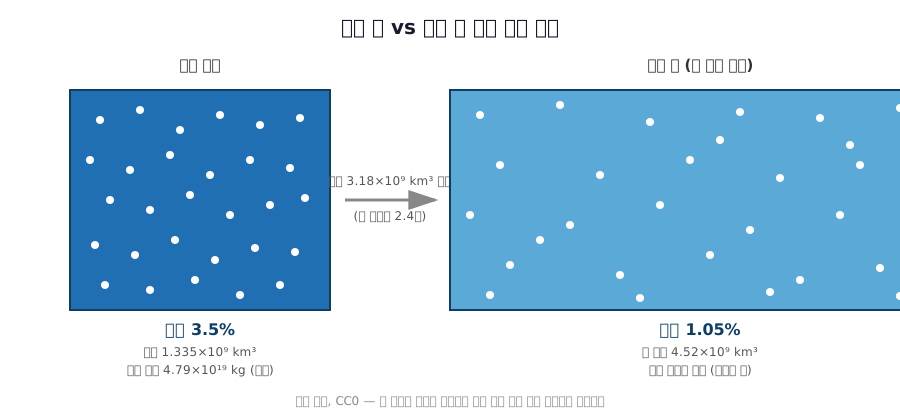
Unit check: dimensionless (ratio) ✓. This 1.05% is a temporary snapshot at maximum flood depth on day 40. The story isn’t over yet.
Step 2 — Where did the water come from? A comparison with atmospheric vapor
Genesis 7:11 (KJV) gives two sources for the water: “the fountains of the great deep [were] broken up, and the windows of heaven were opened.”[14] Checking whether rain alone could supply this volume tells us why the text might need both.
Even if you wrung every last drop of vapor out of the entire atmosphere continuously for all 40 days, with no re-evaporation or recycling, you’d cover only about 1/250,000th of the required volume. Rain alone is nowhere close to enough — and Genesis’s separate mention of “fountains of the great deep” alongside “windows of heaven” lines up with the arithmetic. (This isn’t a theological reading; it’s simply an observation that one of the two sources the text already names turns out to be arithmetically necessary.)
Step 3 — Post-recession (long-run) salinity: the salt stays, the water goes home
Genesis 8:1-14 describes the water beginning to recede at day 150, the Ark coming to rest on the mountains of Ararat, and the waters continuing to withdraw afterward.[12] The text doesn’t specify exactly which landforms absorbed the extra water. The simplest assumption is that it returned to “the ocean basins we know today” (a simplification in its own right, which we revisit below). Under that assumption:
This is identically equal to . Mathematically that’s unsurprising — we back-calculated from in the first place. But the tautology itself carries narrative weight. Salt doesn’t go anywhere unless it evaporates out or is otherwise removed, so once the water returns to its original volume, the concentration returns to its original value too.
Sanity check: , which is the right order (more water in the mix means lower concentration). Model B’s headline is: “the dilution was a temporary event, and the salt stuck around and came back to its original concentration.”
Model A — If you accept Pangaea and catastrophic tectonics: the original ocean was saltier
Restating the premise: this section only holds if you accept the “catastrophic plate tectonics” framework. Under it, today’s 3.5% ocean is already the “post-tectonic-event” state, and the pre-Flood ocean was confined to a smaller, shallower basin. This is a different premise from mainstream plate tectonics, which holds that continents drift a few centimeters a year over hundreds of millions of years.
Step 1 — Back-calculating pre-Flood salinity
Assume the same total salt mass was dissolved in a smaller volume ().
Substituting and simplifying, the term cancels out of the denominator, leaving a clean expression.
Plugging in = 90/75/50/25/10%:
| (pre-Flood basin as % of today’s) | |
|---|---|
| 90% | 3.89% |
| 75% | 4.67% |
| 50% | 7.00% |
| 25% | 14.00% |
| 10% | 35.00% (near saturation, Dead Sea territory) |
A single variable, , swings the result from 3.9% to 35% — almost a tenfold range. For reference, the Dead Sea sits at roughly 34% salinity, one of the saltiest bodies of water on Earth.[15] implies the pre-Flood ocean was effectively as concentrated as the Dead Sea. is the single most unstable variable in this article, and as noted above, no source offers a quantitative estimate for it — hence the table instead of a headline number.
Step 2 — Low-mountain scenario: recalculating the required flood volume
Under the same catastrophic-tectonics framework, if the pre-Flood highest peak was lower than today’s Everest, the absolute amount of water needed to “cover the mountains” changes too.
| (pre-Flood highest peak) | vs. today’s ocean | |
|---|---|---|
| 8.856 km (same as today, control) | km³ | +2.4× |
| 3.0 km (≈9,840 ft) | km³ | +0.15× |
| 2.0 km (≈6,560 ft) | km³ | negative — today’s existing seawater alone would cover it |
| 1.0 km (≈3,280 ft) | km³ | negative |
At km, no additional fresh water is needed at all. The water already in today’s ocean would be more than enough to submerge those lower peaks. That would also make the “atmosphere can’t even supply 1/250,000th of the required water” problem from Model B disappear entirely — this is Model A’s central reversal. But like , is a pure, unsourced assumption with no quantitative grounding in the literature.
Step 3 — Consistency comparison between the two models
The same question — “why is today’s ocean 3.5%?” — gets opposite answers from the two models.
| Item | Model B (fixed geography) | Model A (Pangaea / catastrophic tectonics) |
|---|---|---|
| Today’s 3.5%: what is it? | The value the ocean returned to after diluting | A newly fixed value set by the tectonic event |
| Pre-Flood ocean: what was it? | (not addressed — assumes same geography as today) | Smaller and saltier (, up to Dead Sea levels) |
| Required flood water volume | +2.4× today’s ocean (Everest baseline) | Ranges from +2.4× down to zero, depending on |
| Water-shortage problem (“fountains of the deep” necessity) | Severe (atmosphere covers 1/250,000th) | Vanishes if is low enough |
| Biggest weak point | Can’t pin down exactly which landform the water “went back to” (an assumption) | Both and are pure, unsourced guesses |
| Strength of premise | Computable from today’s known geography alone (mostly solid variables) | Requires accepting a minority position (creation science); conditional on “if you accept this” |
Model C — Was that water fresh or salty?
Premise: Models B and A both dealt only with how much water covered the earth. Neither touched the nature of the water itself — whether it was fresh or salty. In fact, Model B’s math was quietly assuming all along that “the water that fell was pure fresh water.” Model C pulls that hidden assumption out into an explicit variable.
The key insight — the reservoir’s identity determines its salinity
As introduced in [INPUT] above, Genesis names two reservoirs: “the waters above the firmament” (1:6-7) and “the fountains of the great deep” (7:11). Physically, these two reservoirs can’t help but have different properties.
If “the waters above the firmament” existed as atmospheric water vapor, then evaporation and condensation work exactly like distillation (boiling a liquid into vapor and then re-condensing it to extract only the pure component). When seawater evaporates, only water molecules () turn to gas and rise; non-volatile solutes like salt stay behind.[21] Modern seawater desalination plants run on precisely this principle. So whatever water originated in “the waters above the firmament” — no matter how large that reservoir was — has to be fresh () as a matter of physical law.
“The fountains of the great deep” are a different story if they represent a subterranean or seafloor source. Even today, deep groundwater (deep brine) far below the surface, or water venting from seafloor hydrothermal vents, commonly picks up dissolved salts after long contact with minerals.[22] If we treat “the fountains of the great deep” as analogous to this kind of deep brine, water from that reservoir could plausibly carry salinity well above zero — potentially even approaching today’s ocean salinity (3.5%).
In other words, depends on the relative contribution of the two reservoirs. The more the “waters above” dominate, the closer to 0% it lands; the more the “fountains of the deep” dominate, the higher it climbs. Genesis doesn’t quantify how much each reservoir contributed, so this article sweeps across the full range from 0% to 3.5%.
A note on neutrality: some 20th-century creation-science literature proposed reading “the waters above the firmament” as a thick pre-Flood “vapor canopy” wrapping the planet. Even accepting that framework, though, a canopy that dense would have driven surface temperatures up to uninhabitable levels through the greenhouse effect — a thermodynamic problem that has led the hypothesis to be largely abandoned or treated as a minority view even within creation-science circles. Answers in Genesis, one of the most prominent young-earth creationist organizations, acknowledges the thermodynamic difficulties of the vapor-canopy model in its own materials.[23] In other words, this isn’t a mainstream-science-versus-creation-science dispute — it’s a point of internal disagreement within creation science itself. This article doesn’t assert the specific “waters above = vapor canopy” claim; it only uses the physical logic that if “the waters above the firmament” were water vapor, distillation means that water had to be fresh.
The core calculation — mixed salinity
We reuse the same flood volume from Model B’s day-40 snapshot, km³ (same quantity of water — we’re only changing that water’s salinity here). This time, instead of assuming the incoming water is 100% pure fresh water, we let it carry its own salinity , meaning it brings its own dissolved salt along with it.
The denominator is the same kg as Model B’s day-40 snapshot (we hold density fixed at kg/m³ for this approximation; real brine is slightly denser than fresh water, but the error from that simplification is negligible here). The numerator adds the salt carried in by the new water to the salt already in the original ocean, . Plugging in from 0% to 3.5%:
| Note | ||
|---|---|---|
| 0% (pure fresh water — 100% “waters above”) | 1.05% | identical to Model B’s |
| 0.5% | 1.40% | |
| 1.0% | 1.75% | |
| 1.5% | 2.10% | |
| 2.0% | 2.45% | |
| 2.5% | 2.80% | |
| 3.0% | 3.15% | |
| 3.5% (today’s seawater level — 100% “fountains of the deep” at today’s salinity) | 3.50% | dilution effect essentially vanishes |
Plug in and you get exactly Model B’s 1.05%. That’s not a coincidence — it means Model B was implicitly assuming “the water that fell was pure fresh water” all along, and the two models cross-validate at that one point despite being separate calculations. At the opposite end, , the dilution effect disappears entirely — adding water at the same concentration as the existing ocean doesn’t dilute anything.
Sanity check: moving alone from 0% to 3.5% swings the result from 1.05% to 3.5% — more than a threefold spread. That tells us the final salinity depends less on how much water fell and more on where it came from. This is the first time this series has run into that axis.
Model C’s headline is: “without pinning down where the water came from, you can’t even know how diluted the ocean actually got.” lines up with Model B; as rises, Model B’s “diluted, then recovered” narrative becomes progressively less meaningful.
What does this mean for fish? — Three models, one shared conclusion
Model B: comparing the maximum-dilution salinity at day 40 — 1.05% (10.5 ppt) — against survival ranges. That’s more than double the survival ceiling for most freshwater fish (about 0.5%), and less than half the survival floor for stenohaline saltwater fish (about 2.0–2.5%). This range typically falls under what’s called “brackish water” (a salinity range between fresh and salt water, usually 0.5–3%),[16] which is marginal and risky for both pure freshwater and pure saltwater specialists. There are euryhaline (broad-salinity-tolerance) exceptions, though. Salmon and eels are diadromous species — they migrate between rivers and oceans — and can tolerate everything from near-zero salinity to full 3.5% seawater.[17] Tilapia is a well-documented euryhaline species in aquaculture research, with reported tolerance from fresh water up to 35 ppt (nearly full seawater strength).[18]
Model A: if you accept this framework, the pre-Flood ocean could have been as concentrated as 35% (Dead Sea-level) depending on . The only organisms that survive salinity that extreme today are extreme halophiles (“salt-loving” organisms adapted to very high salt concentrations) — a narrow set of specialists like brine shrimp and the high-salt-tolerant microbes found in the Dead Sea and commercial salt evaporation ponds.[19] The claim that “whatever lived in the pre-Flood ocean must have already been adapted to extreme salinity” is only a qualitative observation — there’s no data on the pre-Flood ecosystem that would let us calculate species-level survival rates (needs-assumption).
Model C: comparing fish survival across scenarios turns up an interesting pattern.
| Freshwater fish | Saltwater fish | ||
|---|---|---|---|
| 0% | 1.05% | ✗ | ✗ (no-man’s-land) |
| 1.0% | 1.75% | ✗ | ✗ (no-man’s-land) |
| 2.0% | 2.45% | ✗ | ✓ |
| 3.5% | 3.5% | ✗ | ✓ |
Counterintuitively, the lower is (i.e., the closer to pure fresh water), the more thoroughly both fish types get trapped in a “no-man’s-land” with no safe zone for either. Only once climbs above roughly 2% does saltwater fish get any breathing room. Freshwater fish, on the other hand, never find a safe scenario, at any point on the range.
The cross-model conclusion that holds no matter which one you pick
Now we can pull all three models into a single table. Set the freshwater fish survival ceiling at roughly 0.5% (5 ppt) and the stenohaline saltwater fish survival floor at roughly 2.0% (20 ppt),[10][11] and compare the final salinity from every scenario covered so far.
| Scenario | Salinity | Freshwater fish | Saltwater fish | Both survive? |
|---|---|---|---|---|
| Model B, day-40 snapshot | 1.05% | ✗ | ✗ | ✗ |
| Model B, post-recession | 3.5% | ✗ | ✓ | ✗ |
| Model A, | 3.89% | ✗ | ✓ | ✗ |
| Model A, | 7.00% | ✗ | ✓ | ✗ |
| Model A, | 35.0% | ✗ | ✓ | ✗ |
| Model C, | 1.05% | ✗ | ✗ | ✗ |
| Model C, | 1.75% | ✗ | ✗ | ✗ |
| Model C, | 2.45% | ✗ | ✓ | ✗ |
| Model C, | 3.5% | ✗ | ✓ | ✗ |
Not one of these nine scenarios has a row where both “freshwater fish survive” and “saltwater fish survive” come out ✓. This isn’t a flaw in any particular model. It’s a structural conclusion baked into osmoregulation itself: there simply is no safe zone between the freshwater fish survival ceiling (0.5%) and the saltwater fish survival floor (2.0%). The three models disagree on why today’s ocean is 3.5%, but they agree, without exception, on whether freshwater and saltwater fish could have survived together outside the Ark. The answer is no.
OUTPUT
Ask why today’s ocean is 3.5% salt, and the three models answer in three different directions. Model B says: “at the peak of the flood on day 40, salinity briefly dropped to 1.05% (10.5 ppt), but the salt never went anywhere — once the water receded back into today’s basins, concentration returned to its original 3.5%.” Model A (if you accept Pangaea and catastrophic tectonics) says the reverse: “the original ocean was far saltier than today’s — anywhere from 3.9% up to Dead Sea-level 35%, depending on the assumption — and catastrophic tectonic upheaval widened the basin, resetting salinity to today’s lower concentration.” Model C asks the question the other two never touch: was the water itself fresh or salty to begin with? Depending on the answer, the same flood volume ends up landing anywhere from 1.05% to 3.5% — more than a threefold spread.
It’s genuinely interesting that a single fixed number, the total salt mass kg, can support three completely different stories. All three share one physical law: salt doesn’t go anywhere. What changes is whether you treat the size of the container holding that salt (the ocean basin) as fixed, treat it as having started out smaller, or treat the incoming water itself as carrying a variable amount of salt. Model A’s low-mountain scenario has one more twist, too. Assume the pre-Flood highest peak was only about 3 km, and the “where did all the water come from” problem that dogged Model B nearly evaporates — the required volume drops to just 0.15× today’s ocean. Worth repeating, though: that twist only holds if you accept two unsourced assumptions, and , at the same time.
But there’s exactly one conclusion that survives all three models intact. None of the nine scenarios above ever produced a salinity band where freshwater and saltwater fish could both survive. Even where the models disagree most, osmoregulation — the physical law governing how organisms manage internal versus external salt concentration — doesn’t budge an inch. You can argue the animals somehow made it onto the Ark two by two, but a scenario where the fish outside the Ark all came through fine simply doesn’t show up anywhere in the range this calculation covers.
There’s one option we haven’t tried, though: splitting the water itself. So far we’ve assumed freshwater and saltwater fish had to share a single body of water. What if freshwater fish instead got their own tank inside the Ark, while saltwater fish stayed out in the ocean? To be clear, this isn’t a claim that Genesis actually describes it this way — the traditional reading is that only land animals boarded the Ark, and fish, already living in water, were never candidates for boarding in the first place. What follows is a purely hypothetical thought experiment: could a design have saved everyone, if you allowed for it?
Part 1 found the Ark’s usable volume came to about 20,503 m³ (≈ 724,100 ft³) at the 0.45 m cubit setting, and that the volume needed for two of every land vertebrate (37,700 species) was only about 921 m³ (≈ 32,500 ft³) — a 4.5% load factor.[1] That leaves:
How many species could that spare volume hold as a freshwater fish tank? FishBase records freshwater species at roughly 43% of all described fish, which comes to somewhere around 15,000 species at the low end, up to roughly 18,000 depending on exactly how the count is drawn.[24] Tank volume per species varies enormously. Small species like typical aquarium fish need only about 0.1 m³ (≈ 3.5 ft³, aquarium scale) per breeding pair, while large freshwater species like sturgeon or arapaima need several cubic meters per pair. We bracket the estimate with two representative figures:
Both extremes fit inside the 19,582 m³ budget. In practice, species sizes skew heavily toward the small end (Part 1 already found the same skew in land-vertebrate body sizes[1]), so the real number is probably much closer to the low end. Fish also get a break land animals didn’t: buoyancy means water doesn’t press down on tank floors the way body weight does on a cargo deck, so the same volume carries less structural burden. At the order-of-magnitude level, fitting a freshwater fish tank into the Ark’s spare capacity isn’t a stretch.
There’s a catch, of course. For the ocean-side saltwater fish to survive, salinity out there needs to stay above roughly 2% continuously — but Model B’s day-40 maximum-dilution salinity is 1.05%, well short of that floor. For this split-tank scenario to work, you’d need an additional assumption on top of it: either that the ocean only dipped that low briefly enough for saltwater fish to tough it out, or that the actual geography never let ocean salinity drop that far to begin with. Practical questions — freshwater supply, water quality, feeding — for the onboard tank are also outside the scope of this article. But the math itself is clear: there’s no single salinity where everyone’s safe, but split the water into two containers and the story changes. And as Part 1 already showed, the Ark had the room to spare.
A single salt-mass figure can support three different universes; in none of those three universes could the fish rest easy sharing one body of water; and yet splitting the water into two containers makes full survival work out, at least at the order-of-magnitude level. All three are honest results of the same math. What the design team needed wasn’t a bigger boat — it might have just been a fish tank.
References
[1]: “Could Noah’s Ark Really Fit Two of Every Animal?” (Let’s Calc, Part 1). Compares the Ark’s Genesis dimensions (300×50×30 cubits) against animal volume estimates. https://lets-calc.com/article/noahs-ark-animal-capacity
[2]: Genesis 7:19-20, King James Version. “And the waters prevailed exceedingly upon the earth; and all the high hills, that were under the whole heaven, were covered. Fifteen cubits upward did the waters prevail; and the mountains were covered.”
[3]: International Union of Geodesy and Geophysics (IUGG), Geodetic Reference System 1980 (GRS80). Earth’s mean radius, 6,371 km.
[4]: National Administration of Surveying, Mapping and Geoinformation of China (NASG) and Survey Department of Nepal, joint announcement, December 8, 2020. Resurveyed Everest elevation, 8,848.86 m (rounded 8,849 m). https://en.wikipedia.org/wiki/Mount_Everest (see “21st-century surveys” section, citing the joint announcement)
[5]: Powell, M.A. (1992). “Weights and Measures.” in The Anchor Bible Dictionary, Vol. 6. Doubleday. — Estimates ancient Near Eastern cubit length at roughly 44.5–52.5 cm.
[6]: USGS Water Science School, “How Much Water is There on Earth?” https://www.usgs.gov/special-topics/water-science-school/science/how-much-water-there-earth / NOAA National Ocean Service, “How much water is in the ocean?” https://oceanservice.noaa.gov/facts/oceanwater.html — Global ocean volume, approximately 1.335×10⁹ km³.
[7]: NOAA National Ocean Service, “Why is the ocean salty?” Average ocean salinity 35 PSU (3.5%; dissolved salts make up about 3.5% of seawater by weight). https://oceanservice.noaa.gov/facts/whysalty.html — Surface seawater density (~1,025 kg/m³) and the ~5×10¹⁶ metric ton order-of-magnitude figure for total global dissolved salt are standard values drawn from the UNESCO Intergovernmental Oceanographic Commission’s TEOS-10 seawater equation of state and common oceanography textbook estimates (Pinet, Invitation to Oceanography).
[8]: NASA Atmospheric Infrared Sounder (AIRS) / NOAA reanalysis data. Global average precipitable-water climatology of roughly 20–30 mm, with strong latitudinal variation (~40 mm near the equator, a few mm at the poles). https://airs.jpl.nasa.gov/
[9]: Baumgardner, J.R. (1994). “Runaway subduction as the driving mechanism for the Genesis flood.” Proceedings of the Third International Conference on Creationism, 63-75. — The creation-science catastrophic plate tectonics hypothesis. A minority position relative to mainstream plate tectonics, and one that offers no quantitative estimate of pre-Flood ocean basin size or mountain height. Cited here only as a conditional premise (“if you accept this framework”).
[10]: Evans, D.H. & Claiborne, J.B., eds. (2005). The Physiology of Fishes, 3rd ed. CRC Press. — Osmoregulatory limits and stress-onset salinity (roughly 5 ppt and above) in freshwater teleosts.
[11]: Varsamos, S., Nebel, C. & Charmantier, G. (2005). “Ontogeny of osmoregulation in postembryonic fish: a review.” Comparative Biochemistry and Physiology Part A, 141(4), 401-429. — Low-salinity survival floor (roughly 20–25 ppt) for stenohaline marine species.
[12]: Genesis 8:1-14, King James Version. Describes the waters beginning to recede at day 150, the Ark resting on the mountains of Ararat, and the continued withdrawal of the flood waters.
[13]: Genesis 7:12, King James Version. “And the rain was upon the earth forty days and forty nights.”
[14]: Genesis 7:11, King James Version. “In the six hundredth year of Noah’s life… the same day were all the fountains of the great deep broken up, and the windows of heaven were opened.”
[15]: Oren, A. (2010). “The Dead Sea: current status and future perspectives.” in Halophiles and Hypersaline Environments, Springer. — Measured Dead Sea surface salinity of approximately 34% (340 ppt).
[16]: Day, J.W. et al. (2012). Estuarine Ecology, 2nd ed. Wiley-Blackwell. — Standard definitional range for brackish water (0.5–30 ppt; low-salinity brackish is typically discussed as 0.5–3%).
[17]: McCormick, S.D. (2001). “Endocrine Control of Osmoregulation in Teleost Fish.” American Zoologist, 41(4), 781-794. — Euryhaline physiological mechanisms in diadromous salmonids and eels.
[18]: El-Sayed, A.-F.M. (2006). Tilapia Culture. CABI Publishing. — Aquaculture field data on tilapia salinity tolerance (fresh water to 35 ppt).
[19]: Oren, A. (2002). “Molecular ecology of extremely halophilic Archaea and Bacteria.” FEMS Microbiology Ecology, 39(1), 1-7. — Overview of organisms specialized for extreme-salinity environments (20%+), including brine shrimp (Artemia) and extreme halophilic archaea.
[20]: Genesis 1:6-7, King James Version. “And God said, Let there be a firmament in the midst of the waters, and let it divide the waters from the waters… and God made the firmament, and divided the waters which were under the firmament from the waters which were above the firmament: and it was so.”
[21]: Miller, G. Tyler & Spoolman, Scott (2015). Environmental Science, 15th ed. Cengage Learning. — Overview of purification (distillation) via evaporation-condensation: non-volatile solutes (such as salt) remain in the liquid phase during evaporation while water vapor condenses as pure H₂O. The basic principle behind seawater desalination technologies such as multi-stage flash distillation.
[22]: Kharaka, Y.K. & Hanor, J.S. (2007). “Deep Fluids in the Continents: I. Sedimentary Basins.” in Treatise on Geochemistry, Vol. 5. Elsevier. — Overview of high-salinity deep basinal brine in sedimentary basins and its origins (mineral dissolution, evaporite contact, etc.).
[23]: Answers in Genesis, “Did the Pre-Flood World Have a Vapor Canopy?” (an internal creation-science review of the pre-Flood vapor-canopy model). Acknowledges the thermodynamic difficulties of the vapor-canopy hypothesis (including the problem of latent heat released during condensation warming the surface) and notes that many creation-science researchers today have abandoned or substantially revised the model. https://answersingenesis.org/creationism/did-pre-flood-world-have-vapor-canopy/
[24]: FishBase, “Species by Habitat” statistics. Freshwater species make up roughly 43% of all described fish (about 15,292 species), with estimates running up to roughly 18,000 depending on the exact counting criteria used. https://www.fishbase.se/home.htm