At a red light in Midtown Manhattan during the evening rush, a sedan idles with exactly one person in it. In the lane beside it, a city bus sits less than half full. Which one burns more energy to move a single passenger one kilometer?
Intuition says it can’t be the bus. We’ve all been taught that public transit is the green choice. But that intuition quietly skips over a number: how many people are actually on the bus. This article puts that missing number, occupancy (vehicle occupancy — the share of a vehicle’s capacity that’s actually filled), back into the calculation, and tracks how doing so flips the ranking of transportation modes upside down.
This question holds regardless of the distance you plug in. Take, for instance, a cross-country haul from New York to Los Angeles — about 3,940 km (2,450 mi) as the crow flies.[25] Which mode gets you there on the least energy: a bicycle, a train, a solo drive, or a flight? [OUTPUT] answers that with real numbers.
The yardstick is energy intensity — the energy it takes to move one passenger one kilometer, measured in MJ (megajoules) per passenger-km. Eleven modes get lined up on this same scale: walking, cycling, motorcycles, cars (gasoline and electric), vans, buses, trains, airplanes, ships, and — for scale-breaking comparison — rockets. The result isn’t a single leaderboard. It’s a spectrum that keeps reshuffling every time you change an assumption.
INPUT
1. Fuel energy density for road vehicles
Gasoline and diesel each pack a fixed amount of energy per liter. That figure is called the lower heating value (LHV — the usable thermal energy released when a fuel burns, excluding the latent heat of water vapor produced). Korean national energy statistics use 34.2 MJ/L for gasoline and 38.6 MJ/L for diesel as standard values.[1] The combustion emission factors from the IPCC’s international guidelines are cross-referenced alongside these.[2]
Plug in fuel economy (the inverse of fuel consumed per unit distance) and you get “the energy it takes for one vehicle to travel 1 km” — the vehicle-km energy figure. Official Korean certification statistics for passenger cars typically report 15–16 km/L.[3] But certified fuel economy is measured on a laboratory drive cycle, and it always diverges from real-world driving. The ICCT (International Council on Clean Transportation) has tracked this “real-world vs. certified” gap for years and reports it typically runs 15–20%.[4] This article reflects that gap and adopts 12.5 km/L as the central real-world combined fuel-economy figure — a value that could run as high as 16 km/L under optimistic assumptions, or as low as 10 km/L under conservative ones.
A 125cc motorcycle’s manufacturer-rated fuel economy runs 40–68 km/L,[5] but accounting for real-world conditions (hard acceleration, stop-and-go traffic), this article adopts a conservative 35 km/L. A 12-seat diesel van uses the manufacturer-rated 8.5 km/L.[6]
City buses are a different story. Manufacturer-rated diesel fuel economy sits around 4 km/L, but a study of Seoul’s actual city bus operations reports that real-world fuel economy on stop-heavy downtown routes comes in at only about 2 km/L (= 50 L/100 km).[7] A typical route stops at an average of 76 bus stops, and once intersections and crosswalks are added, the bus can brake and re-accelerate up to 200 times per run.[7] This article adopts that real-world figure rather than the certified one — the “nearly empty bus” reversal later in this piece only holds up if we’re honest about how inefficiently buses actually run in stop-and-go traffic. (This isn’t a Korea-specific quirk: any route with frequent stops, from Seoul to a crosstown bus line in Manhattan, tends to see real-world fuel economy fall well below the certified rating.)
2. Capacity and occupancy
Capacity (seats/passengers) per mode is set at: car 5, van 12, city bus 90 (seated + standing, standard spec for a large city bus)[8], train 900 (a KTX-class long high-speed consist), airplane 180 (standard short-haul narrow-body), ship 300 (coastal ferry), and rocket 4 (crewed mission).
Korea’s national KTDB (Korea Transport Database — roughly analogous to the US National Household Travel Survey) passenger-trip statistics commonly cite average vehicle occupancy in the 1.4–1.6 range.[9] This article uses a central value of 1.5 — a figure that also lands close to typical US averages. For the opposite extreme, a nearly empty late-night city bus is assumed to carry 3 passengers.
3. Metabolic energy for human-powered modes
Walking and cycling don’t burn fuel, but the human body burns chemical energy from food to do either one. This is called metabolic energy, and it’s measured as gross cost — not just the extra energy walking requires, but the baseline resting metabolism you’d burn anyway just sitting still.
A systematic review and meta-analysis of the metabolic cost of walking reports the adult gross cost of walking (GCoW) at about 3.4 J per kg of body weight per meter traveled.[10] Converted for a 70 kg adult (≈154 lb):
Research on bicycle commuting reports an average metabolic equivalent of task (MET — a unit expressing energy expenditure as a multiple of resting metabolic rate; 1 MET ≈ 1 kcal per kg of body weight per hour) of 6.8.[11] Assuming an average urban cycling speed of 15 km/h (≈9.3 mph):
4. Electric vehicles (EVs)
Electric cars sold in Korea have Ministry of Environment-certified efficiency ranging 4.0–6.5 km/kWh depending on the model, with a mid-size sedan central value of about 5.0 km/kWh.[12] Converted to site energy (the energy measured at the point of actual consumption, excluding losses at the power plant):
A note on unit honesty: the gasoline car’s MJ figure is the fuel’s own chemical energy — primary energy, full stop. The EV’s 0.72 MJ/km, by contrast, is just the electricity that came out of the wall socket (site energy); it doesn’t include the energy burned at the power plant to generate that electricity. Taking Korea’s average thermal power plant efficiency at about 37%,[13] the EV’s energy intensity on a primary-energy basis becomes:
In other words, once generation losses are honestly counted, the EV’s energy advantage shrinks considerably. This article’s primary calculations use the site-energy basis (0.72 MJ/km), since that matches the energy unit consumers actually pay for. But this conversion gap is worth keeping in the back of your mind.
5. Rail, aviation, and shipping
These three modes are approached in reverse. Instead of starting from vehicle fuel economy, we start from the energy-per-passenger-km figures the literature already reports at a reference load factor, and back-calculate total vehicle energy from there.
International comparisons of rail energy intensity report that countries with dense rail networks — Korea, Japan, and much of Europe — sit in the 0.2–0.3 MJ/pkm range, below the global average of roughly 0.5 MJ/pkm.[14] This article adopts a central value of 0.25 MJ/pkm, with a reference load factor of 34% of capacity.
For short-haul flights, the commonly cited global aviation-industry average is about 34 passenger-km per liter of fuel.[15] Taking jet fuel’s heating value at about 34.4 MJ/L puts the global average around 1.0 MJ/pkm — but short-haul routes spend a disproportionate share of the flight climbing and descending, which hurts fuel efficiency. This article adopts 1.7 MJ/pkm for short-haul, economy-class flights at an 80% load factor.[15] An 80% average load factor tracks with the recent global average reported by IATA (International Air Transport Association).[16]
For coastal ferries, within the wide vessel-type range presented by the IMO’s (International Maritime Organization) Fourth GHG Study, this article adopts a central value of 0.5 MJ/pkm at a reference load factor of 50%.[17]
6. CO2 emission factors
For modes that burn fossil fuel directly, the emission factor (mass of CO2 released per MJ of fuel energy) is set at 67.5 gCO2/MJ for gasoline, 69.4 gCO2/MJ for diesel, and 73.5 gCO2/MJ for jet fuel.[2] Coastal ferries run on marine fuel oil/marine diesel blends, and the IPCC’s default marine fuel emission factor runs slightly higher than road diesel, so this article adopts 74 gCO2/MJ.[2]
For electricity-based modes (rail, EV), emissions follow the grid’s emission factor. Korea’s finalized national grid emission factor for 2023 is 0.4173 kgCO2/kWh (≈115.9 gCO2/MJ).[18] For a sense of scale, that’s in a similar range to the current US national average grid factor, and somewhat higher than much of the EU, which leans more heavily on nuclear and renewables. This article’s low-carbon-grid slider simplifies things by treating “a 100% coal-fired grid” as the 0% extreme, then reducing emissions from there in proportion to the low-carbon (renewable + nuclear) share. Working backward from the IPCC’s default heating-value-based emission factor for bituminous coal (about 94.6 kgCO2/GJ)[2], divided by average thermal plant efficiency (about 37–38%), gives roughly 0.90 kgCO2/kWh (≈250 gCO2/MJ). This becomes the “100% coal” baseline, and the low-carbon slider’s default is set at 35% — close to Korea’s current share of low-carbon generation (nuclear + renewables).[19]
Human-powered modes (walking, cycling) run on food calories, not fossil fuel. The greenhouse gas emission factor per 1,000 kcal for vegetarian, average, and meat-heavy diets is set at 1.9 / 2.8 / 3.6 kgCO2e per 1,000 kcal respectively, following a peer-reviewed study tracking UK dietary emissions.[20] How much this variable swings the results comes up again in [OUTPUT] — but since this is fundamentally a personal choice about what to eat, this article presents the numbers and leaves the judgment to the reader.
7. Rockets (the extreme case)
Rockets are an entirely different animal from the other ten modes. Reaching low Earth orbit (LEO, altitude ≈400 km / 250 mi) requires a horizontal velocity of about 7.67 km/s (orbital velocity, ).[21] The propellant is the kerosene-based fuel RP-1 and liquid oxygen (LOX). A Falcon 9-class launch vehicle carries about 505,000 kg of total propellant and delivers roughly 22,800 kg of payload to LEO.[22] Using the RP-1/LOX stoichiometric mixture ratio (about 1:2.56), the fuel (RP-1) mass fraction of the propellant works out to about 0.28, and kerosene-based fuel’s heating value is about 43 MJ/kg.[23]
FORMULA
Step 1 — Cars, motorcycles, vans: occupancy changes everything
The energy for one vehicle to travel 1 km (vehicleEnergyPerKm) is the fuel energy density divided by fuel economy.
Assuming a 12-seat van carries 6 people — half its capacity:
That lands above a fully loaded 5-seat car (0.55) but below a motorcycle (0.98) — the chart below plots this exact value.
Dividing this vehicle-km figure by the actual number of riders finally yields the “per passenger” figure — , the backbone metric of this entire article.
When one person drives alone:
The same car, filled to its 5-seat capacity:
Same car, same fuel, same road. The only thing that changed is how many people are in the seats — and the energy intensity differs by a factor of 5.0. None of the car’s own engineering or fuel-economy technology has anything to do with this reversal.
Step 2 — A nearly empty bus can be worse than a car
The city bus is calculated the same way.
Per-passenger figure for a full bus (90 seats/capacity filled):
That’s even lower than walking (0.24) — a full bus is genuinely one of the most efficient ways to move people. But if the same bus is carrying only 3 passengers:
A nearly empty bus burns 2.35 times more energy per passenger than a solo driver. The conventional wisdom — “buses are green, cars are wasteful” — only holds up as long as the bus is actually crowded. This shouldn’t be read as “public transit policy is broken.” Time-of-day and route-level ridership isn’t something a transit agency or city government can dial up at will, and having a bus route running at all is precisely what gives people the option not to drive. What this calculation actually shows isn’t a verdict on any particular mode — it’s that how full a vehicle is decides the ranking, not what the vehicle is.
Step 3 — Walking vs. cycling: walking isn’t free either
Placing the [INPUT] figures side by side:
Cycling uses only about 54% of the energy walking does. Wheels turn sliding friction into rolling friction, and cycling eliminates the up-and-down bob of your center of mass that walking requires with every step. The idea that “walking is free” is wrong — walking burns more chemical energy (food) than cycling does. That said, both figures still sit more than an order of magnitude below any car, bus, or train.
Step 4 — Electric cars: it all depends on how dirty the grid is
Dividing by Korea’s average vehicle occupancy (1.5):
On energy alone, the EV (0.48) is clearly lower than a gasoline car under the same conditions (1.83, see below). CO2 is a different story. From here on, occupancy is stripped out of the comparison — both cars are set to a single occupant — so we’re comparing the cleanliness of the vehicles themselves. With the grid at its default 35% low-carbon share:
Running the same 10 km trip at 0% low-carbon share (a 100% coal-fired grid):
And the same 10 km trip in an average gasoline car with a solo driver (2.74 MJ/km, 67.5 gCO2/MJ):
1.80 versus 1.85 — essentially identical. An EV charged on a coal-heavy grid ends up with CO2 emissions that are practically the same as an average gasoline car, despite the electric motor’s much higher own efficiency (roughly 85–90%, versus 25–30% for an internal combustion engine). The label “electric car = zero-emissions car” quietly leaves out where the electricity came from.
Step 5 — Rail, aviation, shipping: working backward
Dividing this back-calculated total vehicle energy by the actual load factor restores the reference values (0.25 / 1.7 / 0.5 MJ/pkm) exactly — the check works out. The interesting case is aviation. Short-haul economy flights (1.7 MJ/pkm) don’t match a solo car (2.74) exactly, but they land in the same order of magnitude (1–3 MJ/pkm). Nobody flies a plane alone, but most people drive a car alone. The result is that “driving solo” and “flying somewhere” end up costing roughly the same energy per passenger.
Step 6 — Rockets: where the per-km metric collapses
The physically minimum possible specific energy (achieving orbital velocity plus gaining potential energy) is:
On an actual chemical-energy basis:
The gap between the theoretical value (33.2) and the actual value (267) is about 8× — the accumulated cost of the rocket equation’s nonlinearity (the energy spent lifting the propellant itself), gravity losses, and staging inefficiencies. Taking the total launch mass of a crewed capsule carrying 4 astronauts at about 12,500 kg,[24] the mass allocated per person is 3,125 kg, and:
Converting this energy into “the distance a solo-occupant car could travel on the same energy”:
That’s about 7.6 times the Earth’s circumference (40,075 km / 24,901 mi). But try to force this number into “energy per km” and the metric collapses. Use vertical altitude (400 km) as the distance and you get 267 ÷ 400 ≈ 0.67 MJ/kg·km — lower than a motorcycle (0.98). Use orbital circumference (40,075 km) instead and you get 267 ÷ 40,075 ≈ 0.007 MJ/kg·km — practically zero. Same rocket, same 267 MJ/kg, both times — but depending on which distance you divide by, the conclusion swings anywhere from “as efficient as a bicycle” to “basically free.” This is the one case in this article where a per-km metric simply isn’t adopted — for rockets, comparing total energy per person is the honest way to do it.
Step 7 — Ranking modes for one specific trip: New York to Los Angeles
Up to this point, every mode has been compared on the same common basis: “energy to cover 10 km.” This time, we flip the question around — fix one real trip, plug each mode’s energy intensity () into that trip, and rank the results. For the distance, we use the great-circle distance (the shortest straight-line path between two points on a curved Earth) between New York City Hall (40.7128°N, 74.0060°W) and Los Angeles City Hall (34.0537°N, 118.2427°W): about 3,940 km (2,450 mi).[25]
Actually covering that distance takes a different route length for every mode, though. Driving the interstate (I-80, or I-70/I-15, etc.) runs about 4,500 km (2,800 mi) — roughly 14% longer than the straight-line distance.[25] Since the point here is to compare the modes’ energy intensity itself, this article sets that route-length difference aside and plugs the same 3,940 km into every mode — meaning the real total energy for an actual car or train trip would run somewhat higher than the figures below.
At this distance, the vehicle that would actually show up is an intercity coach, not a city bus. So, separately from the city bus (2 km/L real-world fuel economy) already covered in [INPUT], we work out a fresh energy intensity for the intercity coach. A 45-seat highway-class motorcoach[26] gets roughly 4.0 km/L (an industry-reported range of 3.5–4.2 km/L) cruising at a steady highway speed.[26] Converted to vehicle-km energy:
No official average seat-occupancy statistics are published for intercity coaches, so this article adopts 60% — the midpoint between the rail reference load factor already adopted (34%) and the ferry reference load factor (50%) (needs-assumption).[27] With 27 of 45 seats filled (60% of capacity):
This figure describes an entirely different vehicle class from the city bus (0.21 full / 6.43 nearly empty — see Step 2), so it doesn’t contradict anything calculated earlier. If anything, it’s a second reminder that the single word “bus” quietly lumps together two very different vehicles — city bus and intercity coach — with entirely different occupancy patterns and fuel economy.
In the calculator above, the bus doesn’t respond to the “people” slider. A city bus’s occupancy is set by the time of day and the route, not by any individual rider, so wiring it to the headcount input would invite the wrong conclusion. Instead, the calculator hard-codes the representative load factor covered in Step 2 — about 30% of the 90-seat capacity (27 riders) — giving 0.71 MJ/pax·km.[28] The real figure isn’t this one representative value; it swings across the entire range tabulated below, from a packed bus (0.21) to a nearly empty one (6.43). The bus figure the calculator shows is only ever a stand-in for “an average day.”
This time, let’s ask the opposite question. Fix one distance, and rank every mode by how little energy it takes to cover it. The default below is the New York–Los Angeles distance covered above: 3,940 km.
OUTPUT
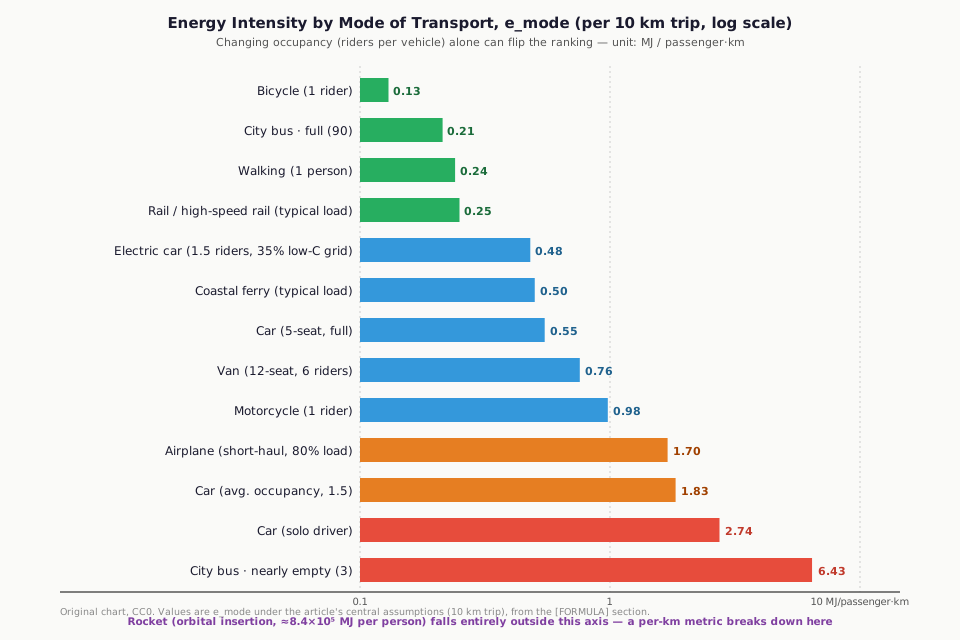
Here’s the full picture (10 km trip, central assumptions).
| Mode | Condition | e_mode (MJ/passenger·km) |
|---|---|---|
| Bicycle | 1 rider | 0.13 |
| City bus | Full (90) | 0.21 |
| Walking | 1 person | 0.24 |
| Rail / high-speed rail | Reference load (34%) | 0.25 |
| Electric car | 1.5 riders, 35% low-carbon grid | 0.48 |
| Coastal ferry | Reference load (50%) | 0.50 |
| Car | Full, 5 seats | 0.55 |
| Van | 12-seat, 6 riders | 0.76 |
| Motorcycle | 1 rider | 0.98 |
| Airplane | Short-haul, 80% load factor | 1.70 |
| Car | Korea average (1.5 riders) | 1.83 |
| Car | Solo driver | 2.74 |
| City bus | Nearly empty (3) | 6.43 |
| Rocket | Orbital insertion, per person | ≈834,375 (total MJ, not a per-km figure) |
Let’s return to the question in the title. Traveling from New York to Los Angeles — about 3,940 km (2,450 mi) as the crow flies, solo, under normal road conditions — the numbers work out to roughly: bicycle ≈512 MJ, rail (an Amtrak-equivalent service, reusing the energy intensity of an electrified high-speed line[25]) ≈985 MJ, a solo driver ≈10,800 MJ, and a short/medium-haul flight (80% load factor) ≈6,700 MJ. If the only question is which mode burns the least energy, the answer is the bicycle. But that answer hides a condition: pedaling all 3,940 km at 15 km/h (9.3 mph). Ridden nonstop — no sleep, no meal breaks, no red lights — that’s still about 11 days in the saddle. The ranking widget above defaults to this same 3,940 km trip, so you can change the number of travel companions and road conditions yourself and watch the entire order reshuffle. The electric car, for instance — 6th place traveling solo — jumps to 2nd place the moment four people split the ride. That’s not a win for automotive engineering. That’s the empty seats getting filled, flipping the order once again.
Five results stand out as particularly counterintuitive.
One. Driving alone burns more energy per person than flying — despite the enormous quantity of fuel a plane consumes. A solo driver runs 2.74 MJ per passenger-km; a short-haul flight runs 1.70 — driving alone costs about 1.6 times as much. A single plane swallows a quantity of fuel a car can’t come close to, but it splits that fuel across some 150 passengers. The solo driver, by contrast, shoulders a full car’s worth of fuel alone. New York to Los Angeles is the same story: driving it alone (about 10,800 MJ) uses more energy than flying it (about 6,700 MJ). The intuition that “a car sips where a plane guzzles” simply doesn’t hold once you are the only person in the car. This comparison assumes short-haul flights at standard load factors — but it doesn’t change the fact that the single most familiar choice we make, driving alone, is one of the most energy-hungry ways to travel on this entire list.
Two. The same car, with occupancy differing by a factor of 5, produces an energy intensity that differs by exactly a factor of 5. No improvement automotive engineering can offer beats the raw power of filling the empty seats.
Three. A nearly empty city bus burns 2.35 times more energy than a solo driver. Calling something a “bus” doesn’t guarantee it’s efficient. That said, this isn’t a leap to “so we should run fewer buses” — ridership is a matter of time of day and route, not whether the bus exists, and the bus has to exist in the first place for people to have an alternative to driving.
Four. An electric car charged on a coal-heavy grid ends up with essentially the same CO2 emissions as an average gasoline car (1.80 vs. 1.85 kgCO2e over 10 km). An EV’s cleanliness is decided by the power plant, not the car.
Five. Run the numbers on a meat-heavy diet, and walking’s food-carbon footprint (about 2.07 kgCO2e over 10 km) exceeds that of an EV on a 35% low-carbon grid (about 1.17 kgCO2e). Cycling on a meat-heavy diet (about 1.12 kgCO2e) lands nearly at parity with the EV too. The claim that “unpowered transport is automatically zero-carbon” quietly leaves out what the person eating fueled themselves with — but since the entire result here hinges on one deeply personal variable, what you eat, the conclusion is left to the reader.
And finally, the rocket. The energy to reach orbit runs about 834,375 MJ per person — enough, converted into car-equivalent distance, to circle the Earth 7.6 times. But force that number into “energy per km” and the answer flips wildly depending on which reference distance you pick: lower than a motorcycle, or practically zero. In the end, maybe what this whole exercise was really trying to say wasn’t “which mode is most efficient,” but that the metric you choose decides the answer before you’ve even run the numbers. Boiled down to one sentence: transportation modes don’t have a ranking of their own — the ranking only attaches to how many people were riding, where the electricity came from, and what the person supplying the muscle power had for lunch. As for how many people were actually on that bus back at the red light in Midtown — this article, in the end, never found out either.
References
[1]: Ministry of Trade, Industry and Energy (Korea), Enforcement Rule of the Energy Act, Appendix 12, “National Default Heating Values and Emission Factors by Fuel,” Korea Law Information Center, https://www.law.go.kr/ — Gasoline lower heating value 34.2 MJ/L; diesel lower heating value 38.6 MJ/L.
[2]: IPCC, 2006 IPCC Guidelines for National Greenhouse Gas Inventories, Volume 2: Energy, Table 1.2 & 2.2, https://www.ipcc-nggip.iges.or.jp/public/2006gl/vol2.html — Gasoline ≈67.5 gCO2/MJ, diesel ≈69.4 gCO2/MJ, jet fuel ≈73.5 gCO2/MJ, marine fuel (heavy fuel oil/marine diesel) ≈74 gCO2/MJ combustion emission factors; bituminous coal heating-value-based emission factor ≈94.6 kgCO2/GJ.
[3]: Korea Energy Agency, “Average Fuel Economy and GHG Emission Standards & Compliance Results for Passenger Vehicles,” transportation energy statistics, https://www.energy.or.kr/ — Domestic certified average passenger car fuel economy (reported in the 15–16 km/L range by year).
[4]: ICCT (International Council on Clean Transportation) & TU Graz, From Laboratory to Road report series, https://theicct.org/ — Reports a 15–20% gap (up to 40% in some cases) between certified and real-world fuel economy in European data.
[5]: Korea Motorcycle News and manufacturer certified fuel economy data (Honda/Suzuki 125cc-class catalogs) — 125cc-class motorcycles report WMTC-certified fuel economy of 40–68 km/L.
[6]: Manufacturer certified fuel economy data (12-seat diesel vans, e.g., Hyundai Solati/Starex class) — Central value of 8.5 km/L adopted to reflect real-world driving conditions (needs-assumption).
[7]: Cheotcha Institute (첫차연구소), “How Much Fuel Does a Bus Actually Use?,” https://v.daum.net/v/caUPeN9sr0 — Based on Seoul city bus statistics: real-world diesel bus fuel economy of about 2 km/L (versus a manufacturer-certified 4 km/L), averaging 76 stops per route (up to 200 stop-and-go events including intersections and crosswalks).
[8]: Hyundai Motor Company commercial vehicle (Aero City/Universe, etc.) specification data — Standard capacity for a large city bus (seated + standing) of about 90 (needs-assumption; ranges 78–105 by model).
[9]: Korea Transport Database (KTDB), National Passenger Travel Survey, https://www.ktdb.go.kr/ — Domestic average passenger car occupancy commonly cited in the 1.4–1.6 range.
[10]: “The Metabolic Cost of Walking in Healthy Young and Older Adults: A Systematic Review and Meta-Analysis,” PMC6620279, https://pmc.ncbi.nlm.nih.gov/articles/PMC6620279/ — Average gross cost of walking (GCoW) in young adults, 3.4±0.4 J/kg·m.
[11]: Oja, P. et al., “Determining the intensity and energy expenditure during commuter cycling,” British Journal of Sports Medicine, PMC2465142, https://pmc.ncbi.nlm.nih.gov/articles/PMC2465142/ — Average commuter cycling MET of 6.8 (SD 1.9).
[12]: Ministry of Environment & Korea Energy Agency, EV integrated information portal, https://www.ev.or.kr/ — Certified efficiency for electric passenger cars sold domestically ranges 4.0–6.5 km/kWh by model (mid-size sedan central value of about 5.0 km/kWh adopted, needs-assumption).
[13]: Korea Electric Power Corporation (KEPCO) / Korea Power Exchange (KPX), Electric Power Statistics Information System, https://epsis.kpx.or.kr/ — Domestic thermal power generation average efficiency of about 37–38%.
[14]: IEA (International Energy Agency), The Future of Rail, 2019, https://www.iea.org/reports/the-future-of-rail — Global average rail energy intensity of about 0.5 MJ/pkm; dense-network countries (Korea, Japan, Europe) report 0.2–0.3 MJ/pkm.
[15]: ICCT, “CO2 Emissions from Commercial Aviation” report series, https://theicct.org/ — Global aviation industry average fuel efficiency of about 34 passenger-km/L (as of 2019); short-haul routes incur a fuel-economy penalty from a proportionally larger climb/descent phase.
[16]: IATA (International Air Transport Association), global airline load factor statistics, https://www.iata.org/ — Recent global average load factor of about 80%.
[17]: IMO (International Maritime Organization), Fourth IMO GHG Study 2020, https://www.imo.org/ — Passenger ship energy intensity varies widely by vessel type and route; this article adopts a central value of 0.5 MJ/pkm (50% reference load factor) (needs-assumption).
[18]: Greenhouse Gas Inventory and Research Center (GIR, Korea), 2023 finalized national grid emission factor announcement, https://www.gir.go.kr/ — 2023 finalized grid emission factor of 0.4173 kgCO2/kWh (down 8.1% from the 2020–2022 average of 0.4541).
[19]: Korea Electric Power Corporation (KEPCO), Electric Power Statistics Flash Report, https://home.kepco.co.kr/ — Domestic low-carbon generation share (nuclear + renewables) of about 35–40% (varies by year).
[20]: Scarborough, P., Appleby, P.N., Mizdrak, A. et al. (2014). “Dietary greenhouse gas emissions of meat-eaters, fish-eaters, vegetarians and vegans in the UK.” Climatic Change, 125, 179–192. https://doi.org/10.1007/s10584-014-1169-1 — Reports daily dietary GHG emissions by diet type: vegetarian (3.81 kgCO2e/day), medium meat-eater (5.63), high meat-eater (7.19); converted to per-1,000-kcal values on a 2,000 kcal/day basis for this article.
[21]: Physics formula , standard Earth mass/radius values (NASA Planetary Fact Sheet, https://nssdc.gsfc.nasa.gov/planetary/factsheet/earthfact.html) — Circular orbital velocity at 400 km altitude of about 7.67 km/s.
[22]: SpaceX, Falcon 9 v1.2 Data Sheet, https://sma.nasa.gov/LaunchVehicle/assets/spacex-falcon-9-v1.2-data-sheet.pdf — Falcon 9 LEO payload of about 22,800 kg (28.5° inclined orbit, expendable configuration with no first-stage recovery, using all propellant for orbital insertion; a typical reusable launch with first-stage landing reduces payload to about 17,400 kg). This article adopts the expendable figure to match the assumption that all propellant goes toward reaching orbit. Total first- and second-stage propellant of about 505,000 kg (needs-assumption; figures vary slightly by source).
[23]: RP-1/LOX stoichiometric mixture ratio (about 1:2.56, O/F ratio) and standard heating value for kerosene-based fuel (about 43 MJ/kg) — standard values from general rocket propulsion literature.
[24]: SpaceX/NASA, Crew Dragon specification data, https://www.spacex.com/vehicles/dragon — Capsule dry mass of about 9,500 kg; total crewed-mission launch mass, including trunk, crew, and consumables, estimated at about 12,500 kg (needs-assumption; official total mass not published, approximate).
[25]: Great-circle distance calculated directly via the Haversine formula between New York City Hall (40.7128°N, 74.0060°W) and Los Angeles City Hall (34.0537°N, 118.2427°W) (original calculation, CC0) — about 3,935.6 km (2,445.5 mi), rounded to 3,940 km (2,450 mi) in this article. For comparison, driving the interstate route (I-80, or I-70/I-15, etc.) runs about 4,500 km (2,800 mi) — roughly 14% longer than the great-circle distance (needs-assumption; exact mileage varies by the specific route chosen). Unlike the Seoul-Busan KTX line this section is modeled on, there is no single direct passenger-rail service connecting New York and Los Angeles — Amtrak’s cross-country trips require transfers and run on diesel-hauled conventional rail, not electrified high-speed rail. The “rail” entry in this section’s ranking is therefore a stand-in: it reuses the dense-network per-passenger-km energy intensity from note [14], not a measurement of an actual existing Amtrak itinerary.
[26]: Kia Granbird highway-class motorcoach (Granbird Silk Road, etc.) official specifications, https://www.kia.com/kr/vehicles/granbird/specification — 45(+1+1)-seat configuration. Steady-state highway fuel economy for a 45-seat highway-class large bus isn’t subject to a separate certified-rating disclosure, so this article adopts 4.0 km/L, the central value within the 3.5–4.2 km/L range reported by bus-class comparison resources (e.g., https://bus.mustarddata.com/guide/bus-grades/) (needs-assumption). This is a Korean intercity coach cited for its underlying fuel-economy figure, used here as a stand-in for a comparable US motorcoach (e.g., a Greyhound- or FlixBus-class vehicle); representative long-haul coach fuel economy in the US falls in a similar range.
[27]: No official average seat-occupancy (load factor) statistics for intercity coaches are separately published by KTDB (Korea Transport Database, https://www.ktdb.go.kr/) beyond aggregate ridership figures, so this article adopts 60% — the midpoint between the rail reference load factor (34%, note 14) and the ferry reference load factor (50%, note 17) already used elsewhere in this piece (needs-assumption).
[28]: The interactive calculator’s city bus figure reuses the real-world fuel economy (2 km/L, note 7) and capacity (90, note 8) adopted in [INPUT] Section 2 and [FORMULA] Step 2, but fixes ridership at a representative 30% of capacity (27 riders) rather than tying it to the headcount slider ( MJ/pax·km, needs-assumption). This isn’t a sourced measurement of actual bus occupancy — it’s a simplification this article chooses for the calculator’s sake. The real range runs from a packed bus (0.21) to a nearly empty one (6.43) MJ/pax·km, as tabulated in the body of the article.