When the news shows a graph of “Arctic sea ice at record-low extent,” the reflex is to picture the ocean creeping higher. But watch an ice cube melt in a glass of water and the water level barely budges. Now balance a second ice cube on the rim of the glass — once that one melts and drips in, the story changes. Earth works the same way. Ice floating on the ocean and ice sitting on land produce completely different outcomes when they melt. This piece runs the actual numbers on that difference, so “how much” and “by when” don’t get mixed up.
INPUT
To calculate sea level rise, we need to separate two questions: how much water could the ocean gain if all the world’s remaining ice melted (potential rise), and what fraction of that will actually melt by a given date (melt rate). This piece uses three ice reservoirs plus the thermal expansion of seawater itself as inputs.
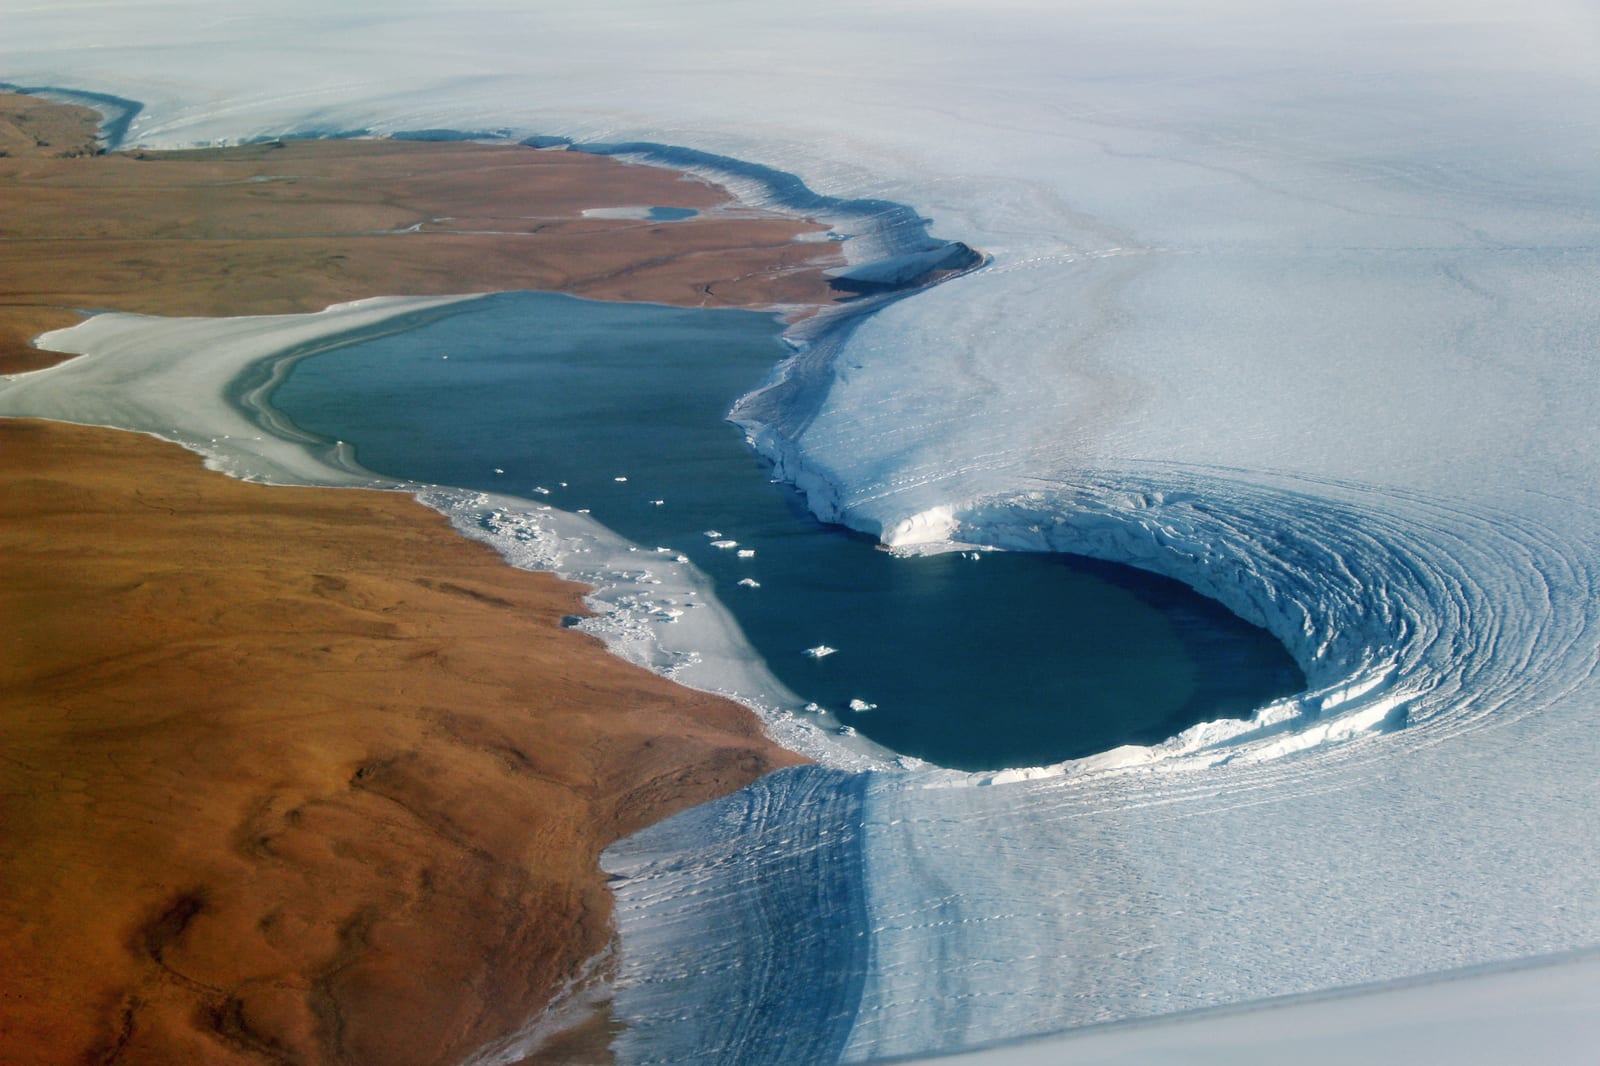
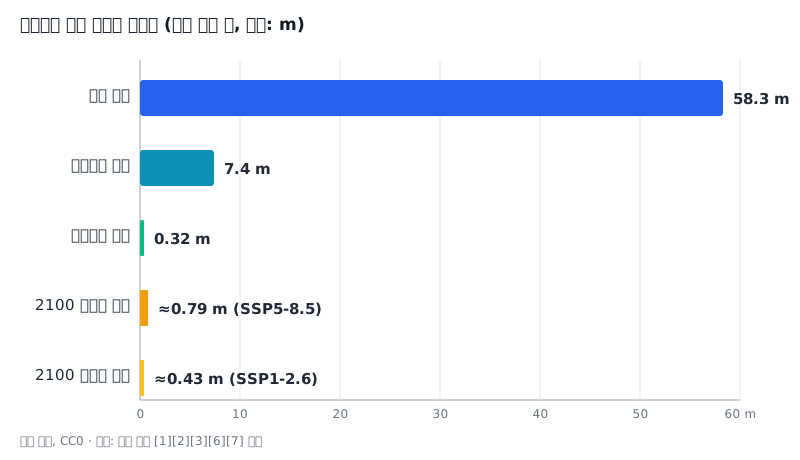
- Potential sea level rise from complete melting of the Greenland ice sheet ≈ 7.4 m (≈ 24.3 ft) — a figure cited by NASA and IPCC AR6 Working Group I, Chapter 9.[1] Greenland is far smaller than Antarctica, but its ice reaches up to 3 km thick, so its contribution is not trivial. This is the central estimate where multiple observational and modeling studies converge.
- Potential sea level rise from complete melting of the Antarctic ice sheet ≈ 58.3 m (≈ 191.3 ft) — based on Bedmap2 (Fretwell et al., 2013), which surveyed the entire continent’s ice thickness by satellite and radar.[2] Internally, East Antarctica accounts for about 53.3 m (174.9 ft), West Antarctica about 4.3 m (14.1 ft), and the Antarctic Peninsula about 0.7 m (2.3 ft) — the three sum to the total 58.3 m. This internal split matters and comes back later. Roughly 90% of Earth’s remaining freshwater ice sits here.
- Potential sea level rise from complete melting of the world’s mountain glaciers (ice sheets excluded) ≈ 0.32 m (≈ 1.05 ft), range 0.24–0.40 m (0.79–1.31 ft) — from an ensemble-model estimate of the thickness of 215,000 glaciers by Farinotti et al. (2019, Nature Geoscience).[3] Every glacier in the Himalayas, the Alps, the Rockies, and Patagonia combined amounts to just 4% of Greenland and 0.5% of Antarctica. This piece adopts the central value of 0.32 m.
- 2100 sea level rise, low-emission scenario (SSP1-2.6), median ≈ 0.44 m (≈ 1.44 ft), likely range 0.32–0.62 m (1.05–2.03 ft) — from Table SPM.1 of the IPCC AR6 WG1 Summary for Policymakers.[4] This scenario assumes an aggressive cut in greenhouse gas emissions; this piece treats it as a central estimate.
- 2100 sea level rise, high-emission scenario (SSP5-8.5), median ≈ 0.77 m (≈ 2.53 ft), likely range 0.63–1.01 m (2.07–3.31 ft) — from the same table, representing a future where current fossil-fuel-heavy trends continue.[4] Both scenarios sit at opposite ends of the five Shared Socioeconomic Pathways (SSPs) the IPCC officially adopted.[10]
- Thermal expansion (the tendency of water to increase in volume as it warms) coefficient K ≈ 0.10 m/°C — not a measured constant, but a simplified approximation this piece introduces. It’s back-calculated by dividing the SSP5-8.5 thermal-expansion contribution for 2100 (about 0.32 m) reported in IPCC AR6 Chapter 9 by that same scenario’s projected ocean warming (about 3.3°C): 0.32 ÷ 3.3 ≈ 0.097, rounded to 0.10.[5] Real ocean thermal expansion varies widely by region depending on circulation patterns and deep-heat uptake rates, so this ratio is a crude global-average model, nothing more.
- Global ocean surface area ≈ 3.61 × 10⁸ km² — an NOAA figure used here only to cross-check that the potential-rise numbers above already account for this surface area.[6]
- Approximate worldwide exposure to coastal flooding — Kulp and Strauss (2019, Nature Communications) recalculated global coastal vulnerability using a neural-network-based elevation model (CoastalDEM) and found that roughly 250 million people already live on land below the current annual coastal-flood line, a figure the paper puts at up to 340 million by mid-century and up to 630 million by 2100 under a high-emission trajectory.[7] This piece builds an approximate curve by interpolating between those benchmark points across other sea-level intervals. It ignores flood defenses like seawalls and drainage pumps entirely, so it’s a “no infrastructure” ceiling, not a real-world risk estimate — read it as inflated relative to actual exposure.
Of these six inputs, the potential-rise figures for Greenland, Antarctica, and mountain glaciers, along with the 2100 scenario medians, are relatively solid numbers from intergovernmental bodies and peer-reviewed papers. The thermal expansion coefficient and the worldwide flood-exposure estimate, on the other hand, are approximations this piece derived or simplified on its own — their limits get flagged repeatedly in [FORMULA] and [OUTPUT].
FORMULA
Why these three reservoirs
Earth’s freshwater ice falls into three broad categories: the Greenland ice sheet, the Antarctic ice sheet, and everything else (mountain glaciers). Sea ice floating on the ocean — Arctic Ocean ice, ice floes around Antarctica — is deliberately excluded from this calculation, for reasons explained below. Total sea level rise is modeled as the sum of the melt contribution from the three reservoirs plus the thermal expansion of seawater itself.
Here is the melt fraction (%) of each reservoir, is the potential sea-level-rise contribution (m) if that reservoir melted completely, is the thermal expansion coefficient (m/°C), and is the rise in global mean ocean temperature (°C).
Plugging in the 2100 low-emission scenario (SSP1-2.6)
Approximating the component breakdown from IPCC AR6 Chapter 9, this scenario assumes 1.0% of Greenland, 0.1% of Antarctica, and 30% of mountain glaciers melt, with ocean temperature rising 2.0°C.
This lands within 2 cm of the IPCC’s own median for this scenario (0.44 m).[4] That closeness isn’t a coincidence — the melt fractions were, in effect, reverse-engineered to hit this median. Which means the exact split between reservoirs (say, Greenland versus mountain glaciers) shouldn’t be taken as confirmed just because the total checks out.
Plugging in the 2100 high-emission scenario (SSP5-8.5)
Using the same approach: 2.5% of Greenland, 0.2% of Antarctica, 50% of mountain glaciers, and a 3.3°C ocean temperature rise.
This also lands within 3 cm of the IPCC median of 0.77 m.[4] What’s notable in both scenarios is that thermal expansion accounts for 25–42% of the total. Contrary to the intuition that “the ocean rises because ice melts,” the share coming from water simply warming up and expanding is far from negligible.
The complete-melt (hypothetical) scenario
Now consider the extreme case where all three reservoirs melt entirely. Here, thermal expansion is fixed at zero — the reasoning follows below.
Why zero out thermal expansion? The conventional “66 m if all the land ice melts” figure accounts only for the mass contribution of ice. How much warmer — and how much more expanded — the ocean would get over a millennia-long timescale varies enormously between ocean-circulation models, too much to assign a meaningful confidence interval. So this 66.02 m is a conservative floor, with thermal expansion stripped out. If complete melting actually happened, the real number would likely run higher.
Comparing timescales — how many times bigger is 66 m than 0.79 m
The complete-melt scenario is about 84 times the 2100 high-emission projection. But these two numbers don’t share a timeline. The 2100 projection is a real trajectory expected within roughly the next 75 years; complete melting is a hypothetical physical ceiling that requires all of Antarctica’s and Greenland’s ice to vanish. Ice sheets are enormously high-inertia systems — even under sustained global warming, the IPCC’s own estimates of ice-sheet dynamical response time put full disappearance at hundreds to thousands of years.[12] Paleoclimate records back up this timescale: during the last interglacial period (the Eemian), roughly 120,000 years ago, temperatures ran 1–2°C warmer than today for thousands of years, yet sea level topped out only about 6–9 m (20–30 ft) higher than present.[11] The mental image of oceans rising by dozens of meters “from warming” simply doesn’t apply on a 2100 timeline.
The Arctic sea ice reversal — Archimedes’ principle
The sea ice blanketing the Arctic Ocean isn’t ice resting on land — it’s ice floating on seawater. A floating object displaces a volume of water equal to its own weight; that’s Archimedes’ principle.[8] The volume of water an ice floe displaces is (density differences aside) essentially equal to the volume of water it produces when it melts. So even if all Arctic sea ice melted, sea level would barely change. Strictly speaking, because freshwater ice is slightly less dense than salty seawater, there’s a tiny drop — on the order of 0.05 mm, well below measurement precision. It’s the same logic as ice cubes in a glass: the water level doesn’t move. This is the exact opposite of what happens with land-based Greenland and Antarctic ice.
Asymmetry within Antarctica — why West Antarctica is the one to watch
Recall that of Antarctica’s total 58.3 m potential contribution, East Antarctica accounts for 53.3 m and West Antarctica for 4.3 m.[2] Looking only at the numbers, West Antarctica seems negligible. But the West Antarctic ice sheet mostly rests on bedrock below sea level — it’s a “marine ice sheet.” When warmer ocean water works its way underneath, the ice sheet can lose its own structural support and collapse via a feedback loop known as marine ice sheet instability, and some of this has already been observed.[9] East Antarctica, by contrast, sits mostly on land above sea level and is comparatively stable. The interactive widget below treats all of Antarctica as a single slider, but it’s worth remembering that the smaller, less dramatic-looking half is the one most likely to move first.
This global flood-exposure figure is an interpolated curve built from Kulp and Strauss’s (2019) benchmark estimates — up to 340 million people exposed by mid-century, rising toward 630 million by 2100 under high emissions — stretched across other sea-level intervals.[7] It doesn’t account for real flood defenses like seawalls or storm barriers, so treat it strictly as a “no countermeasures” ceiling, not a forecast. Note also that the curve’s highest benchmark tops out at 10 m of rise (≈1.8 billion people); the complete-melt scenario (66 m) simply pins the output at that same 1.8 billion figure as a floor, because the paper offers no data point past 10 m — the real number at that scale would be far higher, since land loss of that magnitude redraws coastlines rather than just shifting a flood line. The exposure isn’t spread evenly. A handful of low-lying island nations — Tuvalu, the Maldives, the Marshall Islands, Kiribati — sit at a mean elevation of roughly 1–2 meters (a widely cited, if qualitative, benchmark), meaning even the low-emission scenario threatens the physical land area their populations depend on, not just a coastal strip of it. Large river deltas carry the biggest raw numbers in the underlying dataset: Bangladesh alone accounts for a substantial share of global exposure, and the Mekong and Nile deltas aren’t far behind.[7] Among coastal cities, the reference points most familiar to an English-speaking reader are Miami and South Florida, where CoastalDEM-based studies flag hundreds of thousands of residents living below the annual flood-risk line by 2050; Jakarta, which is sinking fast enough from groundwater extraction that Indonesia is relocating its capital inland partly because of it; and Venice and the Netherlands, both of which already hold back water below sea level with engineered defenses that this “no infrastructure” curve deliberately ignores. South Korea’s own exposure — concentrated around Busan, Incheon, and the Han River estuary — sits well down this list in absolute terms, one case among many rather than the headline.
OUTPUT
Lay the three scenarios side by side:
| Scenario | Sea level rise | Timescale |
|---|---|---|
| 2100 Low-emission (SSP1-2.6) | ≈ 0.43 m (1.41 ft) | Real projection, ~75 years out |
| 2100 High-emission (SSP5-8.5) | ≈ 0.79 m (2.59 ft) | Real projection, ~75 years out |
| Complete melt (hypothetical, conservative floor) | ≈ 66.0 m (216.5 ft) | Hypothetical ceiling, would take centuries to millennia to reach |
The rise actually expected by 2100 falls somewhere between 30 and 80 cm — roughly enough to clear a doorway threshold. The “if all the land ice melted” scenario, by contrast, means water rising by about the height of a 22-story building (roughly 217 feet) — but that’s not a next-century story. It’s a timescale longer than the entirety of recorded human civilization. Putting both numbers in the same sentence to scare people is, mathematically speaking, dishonest.
The most interesting reversal in this whole calculation is Arctic sea ice. The ice that melts most dramatically on the evening news turns out to be the ice that contributes essentially nothing to sea level — a direct betrayal of the “melting ice = rising ocean” intuition. Meanwhile, the far less photogenic West Antarctic ice sheet, which mostly just looks like a thick pile of snow, is the one that actually deserves closer watching.
If there’s one assumption that moves this result the most, it’s the Antarctic melt fraction. In the complete-melt scenario, Antarctica’s 58.3 m accounts for 88% of the total 66.02 m. Nudging the Antarctica slider by 1 percentage point moves the outcome more than moving the Greenland or mountain-glacier sliders by 10 points each. If the question this calculator is really meant to answer is “what variable should I actually worry about,” the answer is unambiguously Antarctica.

References
[1]: NASA Sea Level Change Portal / IPCC AR6 WG1 Chapter 9, “Ocean, Cryosphere and Sea Level Change” — potential sea-level contribution from complete melting of the Greenland ice sheet, about 7.4 m, https://www.ipcc.ch/report/ar6/wg1/chapter/chapter-9/
[2]: Fretwell, P. et al. (2013), “Bedmap2: improved ice bed, surface and thickness datasets for Antarctica”, The Cryosphere, 7, 375–393 — potential sea-level contribution from complete melting of the Antarctic ice sheet, about 58.3 m (East Antarctica 53.3 m / West Antarctica 4.3 m / Peninsula 0.7 m), https://doi.org/10.5194/tc-7-375-2013
[3]: Farinotti, D. et al. (2019), “A consensus estimate for the ice thickness distribution of all glaciers on Earth”, Nature Geoscience, 12, 168–173 — potential sea-level contribution from complete melting of the world’s mountain glaciers (ice sheets excluded), 0.32±0.08 m, https://doi.org/10.1038/s41561-019-0300-3
[4]: IPCC AR6 WG1 Summary for Policymakers, Table SPM.1 — global mean sea level rise median by 2100: SSP1-2.6 0.44 m (likely range 0.32–0.62 m) / SSP5-8.5 0.77 m (likely range 0.63–1.01 m), https://www.ipcc.ch/report/ar6/wg1/
[5]: IPCC AR6 WG1 Chapter 9, Table 9.5 (component-wise decomposition of sea level rise contributions) — based on the SSP5-8.5 scenario’s 2100 thermal-expansion contribution of about 0.32 m, this piece back-calculated K≈0.10 m/°C (=0.32 m ÷ 3.3°C) on its own. This is a simplified approximation, not a substitute for an actual ocean thermal-expansion model. https://www.ipcc.ch/report/ar6/wg1/chapter/chapter-9/
[6]: NOAA National Ocean Service, “How big is the ocean?” — global ocean surface area, about 3.61×10⁸ km², https://oceanservice.noaa.gov/facts/oceandepth.html
[7]: Kulp, S.A. & Strauss, B.H. (2019), “New elevation data triple estimates of global vulnerability to sea-level rise and coastal flooding”, Nature Communications, 10, 4844 — CoastalDEM-based recalculation finding about 250 million people worldwide already live on land below the current annual coastal-flood line, rising to up to 340 million by mid-century and up to 630 million by 2100 under a high-emission (RCP8.5-class) trajectory, with Bangladesh and the Mekong and Nile deltas among the largest concentrations of exposed population, https://doi.org/10.1038/s41467-019-12808-z
[8]: National Snow and Ice Data Center (NSIDC), “Sea Ice and Climate Change” — explanation of why floating (Arctic) sea ice melt has essentially zero effect on sea level, per Archimedes’ principle, https://nsidc.org/learn/parts-cryosphere/sea-ice
[9]: NASA Jet Propulsion Laboratory / IPCC AR6 WG1 Chapter 9 — explanation of the West Antarctic ice sheet’s marine ice sheet structure and marine ice sheet instability, https://climate.nasa.gov/news/2533/
[10]: IPCC AR6 WG1 Chapter 1 — definition of the Shared Socioeconomic Pathway (SSP) scenario framework and the positions of SSP1-2.6 (low-emission) and SSP5-8.5 (high-emission), https://www.ipcc.ch/report/ar6/wg1/chapter/chapter-1/
[11]: Dutton, A. et al. (2015), “Sea-level rise due to polar ice-sheet mass loss during past warm periods”, Science, 349(6244) — paleoclimate reconstruction showing sea level about 6–9 m higher than present during the last interglacial (Eemian), roughly 120,000 years ago, https://doi.org/10.1126/science.aaa4019
[12]: IPCC AR6 WG1 Chapter 9, Executive Summary — explanation of ice-sheet mass loss as a delayed dynamical response occurring over centuries to millennia, https://www.ipcc.ch/report/ar6/wg1/chapter/chapter-9/