A friend once asked: “My americano costs about $3.30 — but what does it actually cost? And how much of that gets back to the farmer?”
Fair question. The trouble is that “what it actually costs” turns out to demand a much more complicated calculation than opening your wallet. There is one price, but there are several different cost lenses.
This article dissects a single americano (200 mL, 10 g of grounds) through three lenses. The first is area — how many square metres of land did this cup require? The second is carbon — how many kg of CO₂ did the bean produce from farm to cup? The third is labour — when you trace back the cherry-picker’s wage, how much of a $3.30 americano actually lands in their hands?
We do the math ourselves. The surprises come after.
INPUT
Conversion Ratios
Variable 1: Grounds per cup
Korean cafes typically use 7–9 g of espresso grounds per single shot. This article adopts 10 g, which corresponds to a double shot or lungo extraction.[1] Centre estimate.
Variable 2: Cherry-to-green-bean yield
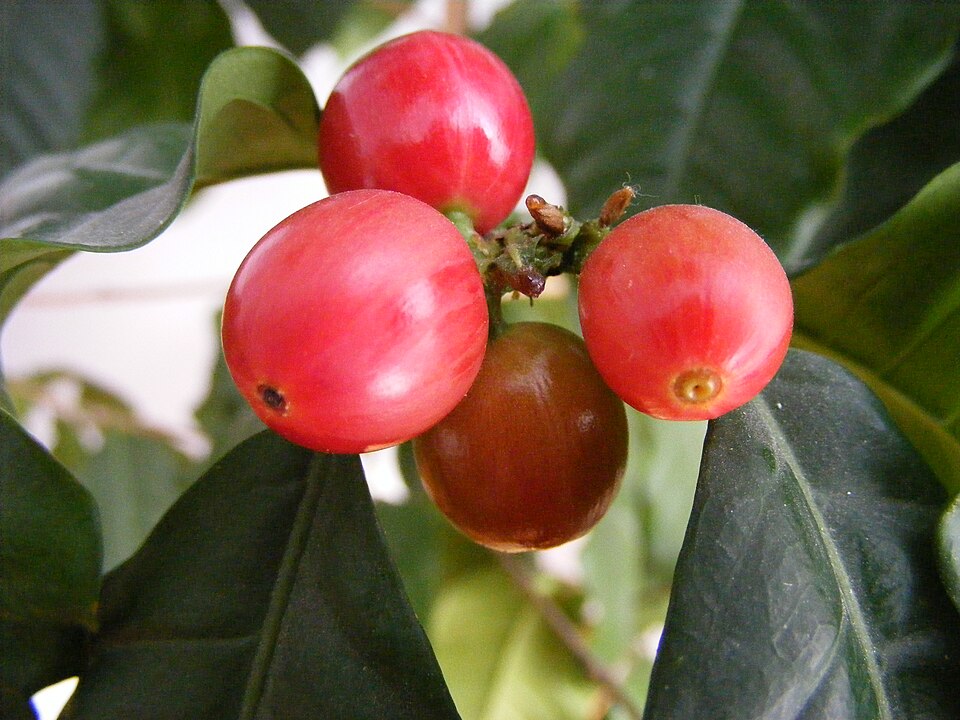
A coffee cherry is the entire fruit of the coffee plant. After the pulp and mucilage are removed and the seed dried, you get the green bean. Under wet (washed) processing, the conversion ratio is 5:1 — 5 g of cherry yields 1 g of green bean.[2] That is a 20% yield.
Variable 3: Green bean to roasted bean yield
Roasting drives off moisture, reducing weight. A medium roast typically returns around 80% of the green bean’s original weight.[2]
Variable 4: Cherry yield per hectare
This is where sources diverge sharply. FAO FAOSTAT data (Ethiopia, 2020) puts average arabica green-bean yield at about 0.67 t/ha.[3] Converted to cherry weight: 0.67 × 5 = 3,350 kg/ha. By contrast, ICO data and agricultural research on smallholder traditional farms consistently cite cherry yields in the 600–800 kg/ha range.[4] That is a four-fold difference. The reason is straightforward: national FAO statistics blend large commercial operations using improved varieties with subsistence smallholders; the 600–800 kg/ha figure is more representative of Ethiopian highland smallholders farming traditional landraces under shade.
This article’s [FORMULA] adopts 800 kg/ha as the centre smallholder estimate. You can adjust it with the slider in the calculator.
Carbon Variables
Variable 5: Carbon emissions by production stage
There is a solid body of Life Cycle Assessment (LCA — a methodology that tallies greenhouse-gas emissions from raw-material extraction through end-of-life disposal) research on coffee. Drawing on the Quantis 2024 LCA commissioned by Nespresso[5] and Oregon DEQ’s literature review[6], the stage-by-stage carbon for one 200 mL black coffee (10 g grounds) is as follows.
| Stage | Share* | kgCO₂e/cup |
|---|---|---|
| Farming () | 49% | 0.033 |
| Processing () | 9% | 0.006 |
| Shipping () | 3% | 0.002 |
| Roasting/manufacturing () | 19% | 0.013 |
| Brewing () | 19% | 0.013 |
| Total (black coffee) | ≈100% | 0.067 |
* Shares are computed against the five-stage total (0.067 kgCO₂e) used here. The source Quantis (2024) LCA reports farming at 47% of the full lifecycle including packaging (8%) and disposal (5%).
Total: roughly 0.07 kgCO₂e. This sits at the conservative end of the espresso-machine research range of 74–96 gCO₂e/cup.[6]
Variable 6: Milk / oat-milk carbon
Poore & Nemecek (2018, Science), aggregating data from 38,000 farms worldwide, put dairy milk at 3.15 kgCO₂e/L.[7] The carbon for 200 mL of milk in a latte:
Oat milk averages 0.9 kgCO₂e/L (Our World in Data, global mean).[8] For 200 mL:
Labour Variables
Variable 7: Day wage for hand-picking
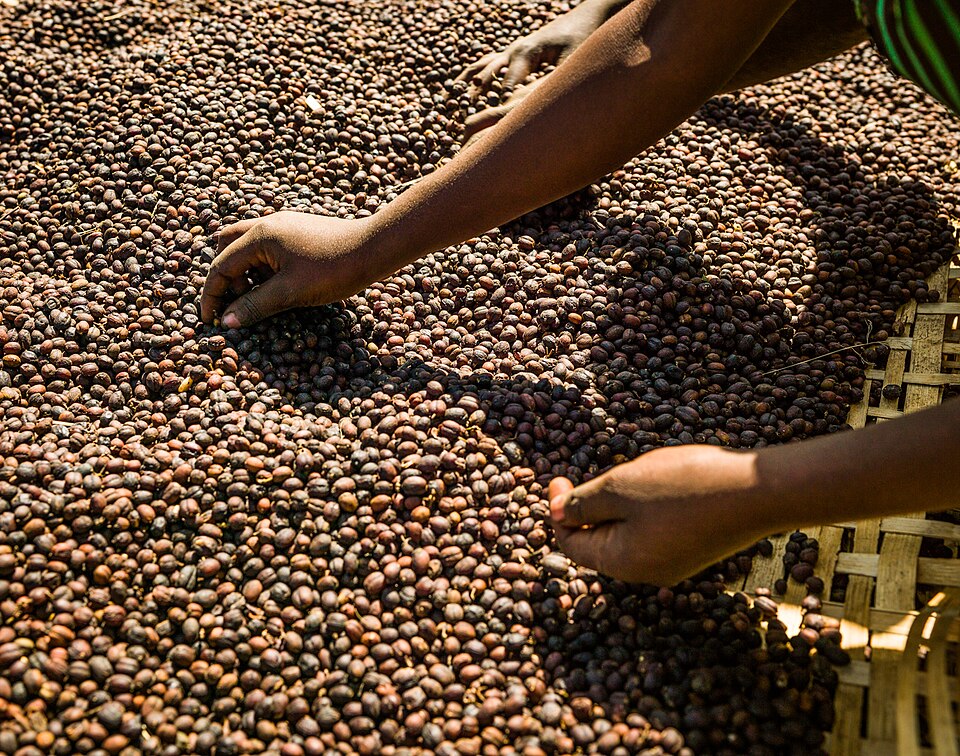
An ILO study published in 2020 (WCMS_765134) directly surveyed coffee-farm worker wages in Costa Rica, Ethiopia, India, Indonesia, and Vietnam.[9] Ethiopian workers in harvest season earned USD 37.5 per month — the lowest of the five countries surveyed.[9] Divided across 25 working days, the daily wage is roughly USD 1.5. Ethiopia has no legally mandated minimum wage for the coffee sector.[9]
For context: Costa Rican pickers in the same ILO survey earned USD 382 per month — more than ten times the Ethiopian figure.[11]
Variable 8: Daily hand-picking volume
Selective hand-picking yields 45–120 kg of cherry per day; the commonly cited centre value is 80 kg/day.[10] At 8 hours of work, the picking rate per second:
Variable 9: Exchange rate and cafe price
This article uses 1,350 KRW/USD (approximate 2024 annual average) for won-to-dollar conversions. The baseline cafe price for a Korean americano is ₩4,500 (about $3.30 as of 2024).[1]
For reference: a regular drip coffee at a US Starbucks runs $3–$4, and a latte $5–$6 — roughly the same ballpark as the Korean americano price used here. The math structure holds whether you substitute a Seoul street-corner cafe or a Brooklyn coffee shop.
FORMULA
Lens 1: Land Area
Step 1: Back-calculate the cherry mass per cup
To get 10 g of roasted grounds, we first ask how much green bean was needed before roasting.
And to get 12.5 g of green bean, how much cherry was needed?
Combining the two steps:
One cup requires 62.5 g of coffee cherry.
Step 2: Area via yield — Method A
Convert the yield into g/m².
Area per cup:
At the more conservative smallholder estimate of 600 kg/ha:
Step 3: Area via tree density — Method B (cross-check)
One arabica tree yields 0.5–3.6 kg of cherry per year.[2] We adopt 2,000 g/tree as the centre value (roughly 2,000 cherries — per Wikipedia Coffea arabica[2]). Standard planting density for arabica is 3,000 trees/ha.[4]
Comparing the two methods:
| Method | Result | Basis |
|---|---|---|
| ICO/FAO yield (smallholder 800 kg/ha cherry) | 0.78 m² | Ethiopian smallholder cherry yield |
| Tree-density back-calc (2,000 g/tree, 3,000 trees/ha) | 0.10 m² | Per-tree yield × planting density |
| FAO national average (3,350 kg/ha cherry) | 0.19 m² | Ethiopia large-and-small farm blend |
The three estimates span a 4–8× range. Two reasons.
First, the underlying populations differ. Traditional smallholder varieties yield 600–800 kg/ha; commercial improved-variety farms exceed 3,000 kg/ha — both exist in Ethiopia, and national statistics average across them.
Second, the tree-density method counts only the footprint of fruit-bearing trees. The hectare-based FAO figure covers the whole farm: non-producing zones, shade trees, paths, and boundary land. Where you draw the boundary determines the answer.
This article’s headline figure is 0.78 m² (smallholder 800 kg/ha basis).
Scaling up to get an intuitive sense: 0.78 m² is the land “share” per cup — not the size of a tree’s footprint, but the fraction of a farm’s annual area that one cup represents. Scaling to annual consumption makes this concrete. South Korea’s per-capita annual coffee consumption is approximately 353 cups (2023, Korea Rural Economic Institute).[12] For comparison, US adult coffee drinkers average around 310 cups per year, while global per-capita consumption sits closer to 130 cups — making South Korea one of the heaviest-consuming nations on a per-person basis. Applying the smallholder figure:
Translated into standard parking spaces (2.5 × 5.0 m = 12.5 m², about 135 sq ft)[16], that comes to roughly 22 spaces — a 22-car parking lot running year-round for one person’s coffee. Scale once more, to a 60-year coffee-drinking lifetime:
That works out to about 1,325 parking spaces, or roughly 2.3 FIFA standard football pitches (105 × 68 m = 7,140 m²).[13] A single cup is one-sixteenth of a parking space; a lifetime of cups is more than two soccer fields of land that spent their entire existence growing your coffee.
Lens 2: Carbon Footprint
Step 1: Five-stage sum for black coffee
Substituting:
Farming (0.033 kgCO₂e) dominates at 49%. Brewing (0.013) and roasting (0.013) are tied at 19% each. Ocean shipping (0.002) contributes just 3% — as long as the coffee travels by container ship rather than air freight, transport is a minor term.
Step 2: The latte reversal
Milk’s share of latte carbon:
90% of a latte’s carbon comes from the milk. The entire coffee supply chain — farming, processing, ocean shipping, roasting, brewing — combined (0.067 kgCO₂e) is one-tenth of the 200 mL of milk (0.63 kgCO₂e). The gap between a black coffee (0.067 kgCO₂e) and a dairy latte (0.70 kgCO₂e) is a factor of roughly 10.
For an oat-milk latte:
Switching from dairy to oat milk drops latte carbon from 0.70 to 0.25 kgCO₂e — a 64% reduction. That is a larger climate move than eliminating all of coffee’s own farming emissions entirely.
Why is dairy’s carbon so large? Cows are ruminants (multi-stomached grazers) that produce methane (CH₄) during digestion — and methane is over 80 times more potent a greenhouse gas than CO₂ on a 20-year horizon. Add the land and fertiliser needed for feed crops (soy, corn), plus forest-to-pasture conversion, and a litre of milk carries a carbon burden in a completely different league from 10 g of coffee grounds. Coffee’s own farming carbon (0.033 kgCO₂e) is roughly 5% of dairy milk’s (0.63 kgCO₂e).
Lens 3: Labour Time and Wages
Step 1: Time to pick one cup’s worth of cherry
Picking rate . Time to pick 62.5 g of cherry:
About 23 seconds. That is how long it takes to hand-pick the cherries that become one americano.
Step 2: Wage per gram
Step 3: Wage attributable to one cup’s cherry
That is USD 0.0012 — about one-tenth of a US cent. In Korean won (at 1,350 KRW/USD):
Step 4: As a fraction of the cafe price
Of a $3.30 americano, the harvest-labour wage attributable to the Ethiopian picker is roughly USD 0.0012 — about 0.035% of the cafe price.
A note on terminology — to avoid conflation: Some sources quote “the farm’s share” at 1–5% of the final price.[4] That figure refers to the farmgate price (FOB) as a fraction of the retail price — it includes land costs, inputs, and the farm owner’s margin. The 0.035% computed here is narrower: it isolates only the harvest labour wage (the act of picking cherries by hand). The two numbers measure different things.
Does mechanical harvesting solve the labour problem? Brazilian mechanised strip-picking can clear 1,000 kg/day or more — over 12 times the hand-picking rate.[10] Plugging that into the formula drops labour time to about 1.8 seconds and wage attribution to roughly USD 0.00009 per cup. On paper, the numbers shrink.
In practice, mechanical harvesting only works on the gently sloped, large-scale farms of Brazil’s Cerrado — not on the steep hillside smallholdings of Ethiopia’s Sidama region or Colombia’s Huila. Geography enforces a hard divide between where mechanisation is feasible and where it is not. There is also a second-order point: reducing labour time is simultaneously reducing jobs. Whose problem is being solved depends on who you ask. Toggle the harvest method in the calculator below to compare both scenarios in real time.
What does a full year look like at the farm level? The calculator below estimates the annual output and income for a single small-scale coffee farm, with sliders for farm size, yield, and farmgate price.
At the default settings, this farm’s daily income is roughly ₩3,240 (about $2.40). A 1.5 ha farm tended year-round produces enough green bean to supply about 54 Korean coffee drinkers for a year (~19,200 cups) — yet a full day’s earnings from it, even before input costs are deducted, are not enough to buy a single $3.30 americano at the cafe that sells the coffee it grew.
OUTPUT
The three lenses side by side:
| Lens | Result | Notes |
|---|---|---|
| Land area | 0.78 m² | Smallholder 800 kg/ha basis; tree-density method gives 0.10 m² |
| Carbon — black | 0.067 kgCO₂e | Farming dominates at 49% |
| Carbon — dairy latte | 0.70 kgCO₂e | Milk dominates at 90% |
| Labour time | ≈23 seconds | Ethiopian smallholder hand-picking |
| Labour wage | ≈USD 0.0012 | 0.035% of the $3.30 cafe price |
Three findings in particular cut against intuition.
One. The moment you add milk, coffee’s own carbon (0.067 kgCO₂e) becomes the tenth-billed actor in the story of what is in your cup. Ninety percent of a latte’s carbon is the milk — not the espresso, not the farm in Ethiopia or Colombia’s Huila valley, not the container ship, not the roastery. The entire coffee supply chain combined cannot catch up to 200 mL of dairy. Switching to oat milk cuts latte carbon by 64%; that is a larger climate move than eliminating all of coffee’s farming emissions. Whether you treat that as a call to action or simply an interesting number is your call — but the arithmetic is unambiguous.
Two. Of a $3.30 americano, USD 0.0012 traces back to the hand that picked the cherry. Adding commentary on top of that figure is not this calculation’s job. What this calculation has done is show exactly how the number was derived, so you can adjust every assumption and watch what changes.
Three. A 1.5 ha smallholder farm, worked for a full year, produces roughly 240 kg of green bean — enough to supply about 54 people’s annual coffee consumption. Selling that at international farmgate prices returns roughly ₩810,000 (≈ USD 600) per year, or about ₩3,240 (≈ USD 2.40) per working day.[14][15] That is before seed, fertiliser, and processing costs. Move the sliders in the calculator above; the arithmetic is sensitive to both yield and farmgate price, which is precisely why direct-trade and Fairtrade pricing structures exist.
References
[1]: Korea Consumer Agency, “Survey on Coffee Shop Prices and Usage,” 2023. https://www.kca.go.kr — basis for ₩4,000–5,000 average americano price range; espresso dose 7–10 g per shot.
[2]: Wikipedia, “Coffea arabica”, https://en.wikipedia.org/wiki/Coffea_arabica — annual cherry yield per tree 0.5–3.6 kg; FAO, “Arabica Coffee Manual for Lao PDR”, https://www.fao.org/4/ae939e/ae939e08.htm — cherry-to-green-bean ratio 5:1, roasting yield approx. 80%.
[3]: FAO FAOSTAT, “Coffee, green — Yield, Ethiopia 2019–2020”, https://www.fao.org/faostat/ — Ethiopia average green-bean yield approx. 0.67 t/ha. Ewnetu, T. et al. (2021), “Trend, instability and decomposition analysis of coffee production in Ethiopia (1993–2019)”, Cogent Food & Agriculture, PMC8461354, https://pmc.ncbi.nlm.nih.gov/articles/PMC8461354/ — cross-check for 0.67–0.72 t/ha AGP-period average.
[4]: ICO (International Coffee Organization), Coffee Development Report 2020: Growing for Prosperity, https://ico.org/coffee-development-report — arabica smallholder cherry yield range 600–800 kg/ha; Ethiopia farmgate-to-FOB ratio below 50%. Planting density 2,500–3,000 trees/ha.
[5]: Quantis / Nestlé Nespresso, Life Cycle Assessment of an Espresso Cup of Coffee — Executive Summary, Quantis 2024, https://nestle-nespresso.com/sites/site.prod.nestle-nespresso.com/files/Nespresso_European_LCA_Executive_Summary_Quantis_2024.pdf — stage-by-stage carbon shares: farming 47%, roasting/manufacturing 18%, consumer brewing 19%, packaging 8%, transport 3%, disposal 5%.
[6]: Oregon DEQ (Department of Environmental Quality), Food Product Environmental Footprint Literature Summary: Coffee, 2021, https://www.oregon.gov/deq/filterdocs/pef-coffee-fullreport.pdf — LCA range for 200 mL black coffee 60–96 gCO₂e/cup; espresso machine 74–96 gCO₂e/cup. Stage-share literature synthesis.
[7]: Poore, J. & Nemecek, T. (2018). “Reducing food’s environmental impacts through producers and consumers.” Science, 360(6392), 987–992. https://doi.org/10.1126/science.aaq0216 — global average dairy milk emissions 3.15 kgCO₂e/L. Our World in Data visualisation: https://ourworldindata.org/environmental-impact-milks
[8]: Our World in Data, “Dairy vs. plant-based milk: what are the environmental impacts?”, https://ourworldindata.org/environmental-impact-milks — global average oat-milk emissions approx. 0.9 kgCO₂e/L (aggregated from Poore & Nemecek 2018). Oatly CarbonCloud audited figure for own product: 0.43–0.64 kgCO₂e/L (Oatly, Climate Footprint, 2023, https://www.oatly.com/oatly-who/sustainability-plan/climate-footprint-product-label).
[9]: ILO (International Labour Organization), Wages and working conditions in the coffee sector: the case of Costa Rica, Ethiopia, India, Indonesia and Viet Nam, WCMS_765134, 2020. https://www.ilo.org/wcmsp5/groups/public/---ed_protect/---protrav/---travail/documents/projectdocumentation/wcms_765134.pdf — Ethiopian coffee harvest worker monthly income USD 37.5, lowest of five countries surveyed. No statutory minimum wage for the coffee sector confirmed.
[10]: Perfect Daily Grind, “Hand-Picked vs Mechanized Coffee Harvesting”, 2017, https://perfectdailygrind.com/2017/07/hand-picked-vs-mechanized-coffee-harvesting/ — selective hand-picking 45–120 kg/day; mechanical harvesting (Brazil) 1,000+ kg/day. Centre value of 80 kg/day adopted.
[11]: The Reporter Ethiopia, “At USD37.5, Ethiopian Workers Earn Lowest Wage Among Major Producers of Coffee”, 2021, https://www.thereporterethiopia.com/10705/ — cites ILO WCMS_765134; Ethiopia USD 37.5/month vs. Costa Rica USD 382.1/month gap confirmed.
[12]: Korea Rural Economic Institute (KREI), “2023 Food Consumption Behavior Survey,” 2023. — Korea per-capita annual coffee consumption approx. 353 cups (adult population basis). Data access: https://www.krei.re.kr
[13]: IFAB (International Football Association Board), Laws of the Game 2023/24, Law 1 — The Field of Play, https://www.theifab.com/laws/latest/the-field-of-play/ — recommended international match dimensions: 100–110 m × 64–75 m. FIFA standard 105 × 68 m = 7,140 m² (≈ 76,900 sq ft); FIFA, Football Stadiums Technical Recommendations and Requirements, 5th ed., 2011.
[14]: Fairtrade International, Fairtrade Minimum Price and Premium for Coffee, effective 1 August 2023, https://www.fairtrade.net/en/why-fairtrade/how-we-do-it/standards/fairtrade-minimum-price-and-premium-information — washed arabica minimum FOB price USD 1.80/lb (≈ USD 3.97/kg). Farmgate share typically 50–70% of FOB, with wide variation depending on cooperative membership and direct-trade arrangements (Solidaridad, “Coffee producer country profile: Ethiopia”, 2024, https://www.solidaridadnetwork.org/wp-content/uploads/2024/06/The-Grounds-for-Sharing-annex-Ethiopia.pdf). Default value of USD 2.5/kg reflects a mid-range estimate for cooperative trading conditions.
[15]: ICO (International Coffee Organization) / World Bank, Coffee Development Report 2020: Growing for Prosperity, https://ico.org/coffee-development-report — over 95% of coffee smallholders worldwide farm less than 2 ha. Ethiopian smallholders average under 1 ha of coffee land (Frontiers in Sustainable Food Systems, “Smallholder Coffee in the Global Economy”, 2022, https://doi.org/10.3389/fsufs.2022.808207). Default of 1.5 ha reflects a medium Ethiopian smallholder scenario.
[16]: Standard parking-space dimensions: South Korea’s Parking Lot Act Enforcement Rule Art. 3 specifies a minimum 2.5 m × 5.0 m (= 12.5 m²) for a standard stall; comparable to a US compact space (~135 sq ft). Korea Ministry of Land, Infrastructure and Transport, https://www.law.go.kr/.